PNC Bank 2010 Annual Report Download - page 60
Download and view the complete annual report
Please find page 60 of the 2010 PNC Bank annual report below. You can navigate through the pages in the report by either clicking on the pages listed below, or by using the keyword search tool below to find specific information within the annual report.-
 1
1 -
2
-
3
-
4
-
5
-
6
-
7
-
8
-
9
-
10
-
11
-
12
-
13
-
14
-
15
-
16
-
17
-
18
-
19
-
20
-
21
-
22
-
23
-
24
-
25
-
26
-
27
-
28
-
29
-
30
-
31
-
32
-
33
-
34
-
35
-
36
-
37
-
38
-
39
-
40
-
41
-
42
-
43
-
44
-
45
-
46
-
47
-
48
-
49
-
 50
50 -
 51
51 -
 52
52 -
 53
53 -
 54
54 -
 55
55 -
 56
56 -
 57
57 -
 58
58 -
 59
59 -
 60
60 -
 61
61 -
 62
62 -
 63
63 -
 64
64 -
 65
65 -
 66
66 -
 67
67 -
 68
68 -
 69
69 -
 70
70 -
71
-
72
-
73
-
74
-
75
-
76
-
77
-
78
-
79
-
80
-
81
-
82
-
83
-
84
-
85
-
86
-
87
-
88
-
89
-
90
-
91
-
92
-
93
-
94
-
95
-
96
-
97
-
98
-
99
-
100
-
101
-
102
-
103
-
104
-
105
-
106
-
107
-
108
-
109
-
110
-
111
-
112
-
113
-
114
-
115
-
116
-
117
-
118
-
119
-
120
-
121
-
122
-
123
-
124
-
125
-
126
-
127
-
128
-
129
-
130
-
131
-
132
-
133
-
134
-
135
-
136
-
137
-
138
-
139
-
140
-
141
-
142
-
143
-
144
-
145
-
146
-
147
-
148
-
149
-
150
-
151
-
152
-
153
-
154
-
155
-
156
-
157
-
158
-
159
-
160
-
161
-
162
-
163
-
164
-
165
-
166
-
167
-
168
-
169
-
170
-
171
-
172
-
173
-
174
-
175
-
176
-
177
-
178
-
179
-
180
-
181
-
182
-
183
-
184
-
185
-
186
-
187
-
188
-
189
-
190
-
191
-
192
-
193
-
194
-
195
-
196
-
197
-
198
-
199
-
200
-
201
-
202
-
203
-
204
-
205
-
206
-
207
-
208
-
209
-
210
-
211
-
212
-
213
-
214
 |
 |

C
ORPORATE
&I
NSTITUTIONAL
B
ANKING
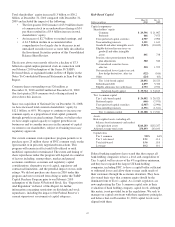
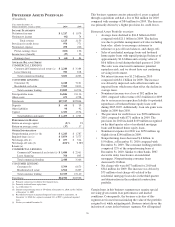
(Unaudited)
Year ended December 31
Dollars in millions except as noted 2010 (a) 2009
I
NCOME
S
TATEMENT
Net interest income $ 3,545 $ 3,833
Noninterest income
Corporate service fees 961 915
Other 402 518
Noninterest income 1,363 1,433
Total revenue 4,908 5,266
Provision for credit losses 303 1,603
Noninterest expense 1,817 1,800
Pretax earnings 2,788 1,863
Income taxes 1,018 673
Earnings $ 1,770 $ 1,190
A
VERAGE
B
ALANCE
S
HEET
Loans
Commercial $32,717 $37,426
Commercial real estate 16,466 19,195
Commercial – real estate related 3,076 3,772
Asset-based lending 6,318 6,344
Equipment lease financing 5,484 5,390
Total loans 64,061 72,127
Goodwill and other intangible assets 3,613 3,583
Loans held for sale 1,473 1,679
Other assets 8,320 7,300
Total assets $77,467 $84,689
Deposits
Noninterest-bearing demand $24,713 $19,948
Money market 12,153 9,697
Other 6,980 7,911
Total deposits 43,846 37,556
Other liabilities 11,949 9,118
Capital 7,598 7,837
Total liabilities and equity $63,393 $54,511
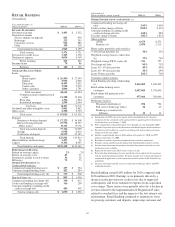
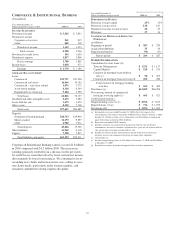
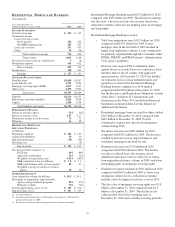
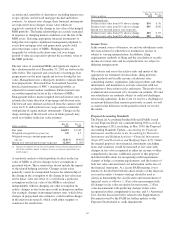
Corporate & Institutional Banking earned a record $1.8 billion
in 2010 compared with $1.2 billion 2009. The increase in
earnings primarily resulted from a decrease in the provision
for credit losses somewhat offset by lower net interest income
driven mainly by lower loan balances. We continued to focus
on adding new clients and increased our cross selling to serve
our clients needs, particularly in the western markets, and
remained committed to strong expense discipline.
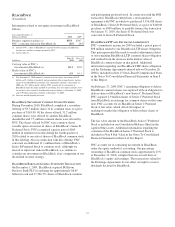
Year ended December 31
Dollars in millions except as noted 2010 (a) 2009
P
ERFORMANCE
R
ATIOS
Return on average capital 23% 15%
Return on average assets 2.28 1.41
Noninterest income to total revenue 28 27
Efficiency 37 34
C
OMMERCIAL
M
ORTGAGE
S
ERVICING
P
ORTFOLIO
(in billions)
Beginning of period $ 287 $ 270
Acquisitions/additions 35 50
Repayments/transfers (56) (33)
End of period $ 266 $ 287
O
THER
I
NFORMATION
Consolidated revenue from: (b)
Treasury Management $ 1,225 $ 1,137
Capital Markets $ 618 $ 533
Commercial mortgage loans held for
sale (c) $58$ 205
Commercial mortgage loan servicing (d) 204 280
Total commercial mortgage banking
activities $ 262 $ 485
Total loans (e) $63,609 $66,206
Net carrying amount of commercial
mortgage servicing rights (e) $ 665 $ 921
Credit-related statistics:
Nonperforming assets (e) (f) $ 2,594 $ 3,167
Impaired loans (e) (g) $ 714 $ 1,075
Net charge-offs $ 1,074 $ 1,052
(a) Information as of year ended December 31, 2010 reflects the impact of the
consolidation in our financial statements of Market Street effective January 1, 2010.
Includes $1.5 billion of loans, net of eliminations, and $2.6 billion of commercial
paper borrowings included in Other liabilities.
(b) Represents consolidated PNC amounts.
(c) Includes valuations on commercial mortgage loans held for sale and related
commitments, derivative valuations, origination fees, gains on sale of loans held for
sale and net interest income on loans held for sale.
(d) Includes net interest income and noninterest income from loan servicing and
ancillary services and commercial mortgage servicing rights valuations.
(e) At December 31.
(f) Includes nonperforming loans of $2.4 billion at December 31, 2010 and $3.0 billion
at December 31, 2009.
(g) Recorded investment of purchased impaired loans related to acquisitions.
52