PNC Bank 2010 Annual Report Download - page 82
Download and view the complete annual report
Please find page 82 of the 2010 PNC Bank annual report below. You can navigate through the pages in the report by either clicking on the pages listed below, or by using the keyword search tool below to find specific information within the annual report.-
 1
1 -
2
-
3
-
4
-
5
-
6
-
7
-
8
-
9
-
10
-
11
-
12
-
13
-
14
-
15
-
16
-
17
-
18
-
19
-
20
-
21
-
22
-
23
-
24
-
25
-
26
-
27
-
28
-
29
-
30
-
31
-
32
-
33
-
34
-
35
-
36
-
37
-
38
-
39
-
40
-
41
-
42
-
43
-
44
-
45
-
46
-
47
-
48
-
49
-
50
-
51
-
52
-
53
-
54
-
55
-
56
-
57
-
58
-
59
-
60
-
61
-
62
-
63
-
64
-
65
-
66
-
67
-
68
-
69
-
70
-
71
-
 72
72 -
 73
73 -
 74
74 -
 75
75 -
 76
76 -
 77
77 -
 78
78 -
 79
79 -
 80
80 -
 81
81 -
 82
82 -
 83
83 -
 84
84 -
 85
85 -
 86
86 -
 87
87 -
 88
88 -
 89
89 -
 90
90 -
 91
91 -
 92
92 -
93
-
94
-
95
-
96
-
97
-
98
-
99
-
100
-
101
-
102
-
103
-
104
-
105
-
106
-
107
-
108
-
109
-
110
-
111
-
112
-
113
-
114
-
115
-
116
-
117
-
118
-
119
-
120
-
121
-
122
-
123
-
124
-
125
-
126
-
127
-
128
-
129
-
130
-
131
-
132
-
133
-
134
-
135
-
136
-
137
-
138
-
139
-
140
-
141
-
142
-
143
-
144
-
145
-
146
-
147
-
148
-
149
-
150
-
151
-
152
-
153
-
154
-
155
-
156
-
157
-
158
-
159
-
160
-
161
-
162
-
163
-
164
-
165
-
166
-
167
-
168
-
169
-
170
-
171
-
172
-
173
-
174
-
175
-
176
-
177
-
178
-
179
-
180
-
181
-
182
-
183
-
184
-
185
-
186
-
187
-
188
-
189
-
190
-
191
-
192
-
193
-
194
-
195
-
196
-
197
-
198
-
199
-
200
-
201
-
202
-
203
-
204
-
205
-
206
-
207
-
208
-
209
-
210
-
211
-
212
-
213
-
214
 |
 |

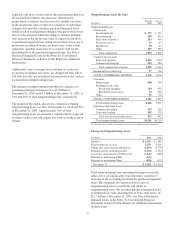
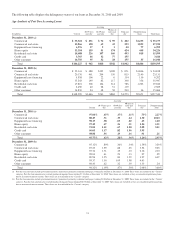
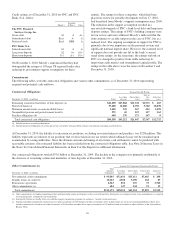
The following table displays the delinquency status of our loans at December 31, 2010 and 2009.
Age Analysis of Past Due Accruing Loans
Accruing
In millions Current
30-59 days
past due
60-89 days
past due
90 days or
more past
due
Total past
due
Nonperforming
loans Total loans
December 31, 2010 (a)
Commercial $ 53,522 $ 251 $ 92 $ 59 $ 402 $1,253 $ 55,177
Commercial real estate 15,866 128 62 43 233 1,835 17,934
Equipment lease financing 6,276 37 2 1 40 77 6,393
Home equity 33,354 159 91 174 424 448 34,226
Residential real estate 14,688 226 107 160 493 818 15,999
Credit card 3,765 46 32 77 155 3,920
Other consumer 16,756 95 32 28 155 35 16,946
Total $144,227 $ 942 $418 $542 $1,902 $4,466 $150,595
December 31, 2009 (b)
Commercial $ 52,141 $ 488 $195 $188 $ 871 $1,806 $ 54,818
Commercial real estate 20,176 461 204 150 815 2,140 23,131
Equipment lease financing 5,938 106 22 6 134 130 6,202
Home equity 35,243 149 82 117 348 356 35,947
Residential real estate 17,821 308 164 314 786 1,203 19,810
Credit card 2,450 40 28 51 119 2,569
Other consumer 14,830 94 48 58 200 36 15,066
Total $148,599 $1,646 $743 $884 $3,273 $5,671 $157,543
Accruing
Current
30-59 days past
due
60-89 days
past due
90 days or
more past
due
Total past
due
Nonperforming
loans
December 31, 2010 (a)
Commercial 97.00% .45% .17% .11% .73% 2.27%
Commercial real estate 88.47 .71 .35 .24 1.30 10.23
Equipment lease financing 98.17 .58 .03 .02 .63 1.20
Home equity 97.45 .47 .26 .51 1.24 1.31
Residential real estate 91.81 1.41 .67 1.00 3.08 5.11
Credit card 96.05 1.17 .82 1.96 3.95
Other consumer 98.88 .56 .19 .16 .91 .21
Total 95.77% .62% .28% .36% 1.26% 2.97%
December 31, 2009 (b)
Commercial 95.12% .89% .36% .34% 1.59% 3.29%
Commercial real estate 87.23 1.99 .88 .65 3.52 9.25
Equipment lease financing 95.74 1.71 .35 .10 2.16 2.10
Home equity 98.04 .41 .23 .33 .97 .99
Residential real estate 89.96 1.55 .83 1.59 3.97 6.07
Credit card 95.37 1.56 1.09 1.98 4.63
Other consumer 98.43 .62 .32 .39 1.33 .24
Total 94.32% 1.05% .47% .56% 2.08% 3.60%
(a) Past due loan amounts exclude government insured / guaranteed, primarily residential mortgages, totaling $2.6 billion at December 31, 2010. These loans are included in the ‘Current’
category. Past due loan amounts also exclude purchased impaired loans totaling $7.8 billion at December 31, 2010. These loans are excluded as they are considered performing loans
due to accretion of interest income. These loans are also included in the ‘Current’ category.
(b) Past due loan amounts exclude government insured / guaranteed, primarily residential mortgages, totaling $2.0 billion at December 31, 2009. These loans are included in the ‘Current’
category. Past due loan amounts also exclude purchased impaired loans totaling $10.3 billion at December 31, 2009. These loans are excluded as they are considered performing loans
due to accretion of interest income. These loans are also included in the ‘Current’ category.
74