PNC Bank 2010 Annual Report Download - page 59
Download and view the complete annual report
Please find page 59 of the 2010 PNC Bank annual report below. You can navigate through the pages in the report by either clicking on the pages listed below, or by using the keyword search tool below to find specific information within the annual report.-
 1
1 -
2
-
3
-
4
-
5
-
6
-
7
-
8
-
9
-
10
-
11
-
12
-
13
-
14
-
15
-
16
-
17
-
18
-
19
-
20
-
21
-
22
-
23
-
24
-
25
-
26
-
27
-
28
-
29
-
30
-
31
-
32
-
33
-
34
-
35
-
36
-
37
-
38
-
39
-
40
-
41
-
42
-
43
-
44
-
45
-
46
-
47
-
48
-
 49
49 -
 50
50 -
 51
51 -
 52
52 -
 53
53 -
 54
54 -
 55
55 -
 56
56 -
 57
57 -
 58
58 -
 59
59 -
 60
60 -
 61
61 -
 62
62 -
 63
63 -
 64
64 -
 65
65 -
 66
66 -
 67
67 -
 68
68 -
 69
69 -
70
-
71
-
72
-
73
-
74
-
75
-
76
-
77
-
78
-
79
-
80
-
81
-
82
-
83
-
84
-
85
-
86
-
87
-
88
-
89
-
90
-
91
-
92
-
93
-
94
-
95
-
96
-
97
-
98
-
99
-
100
-
101
-
102
-
103
-
104
-
105
-
106
-
107
-
108
-
109
-
110
-
111
-
112
-
113
-
114
-
115
-
116
-
117
-
118
-
119
-
120
-
121
-
122
-
123
-
124
-
125
-
126
-
127
-
128
-
129
-
130
-
131
-
132
-
133
-
134
-
135
-
136
-
137
-
138
-
139
-
140
-
141
-
142
-
143
-
144
-
145
-
146
-
147
-
148
-
149
-
150
-
151
-
152
-
153
-
154
-
155
-
156
-
157
-
158
-
159
-
160
-
161
-
162
-
163
-
164
-
165
-
166
-
167
-
168
-
169
-
170
-
171
-
172
-
173
-
174
-
175
-
176
-
177
-
178
-
179
-
180
-
181
-
182
-
183
-
184
-
185
-
186
-
187
-
188
-
189
-
190
-
191
-
192
-
193
-
194
-
195
-
196
-
197
-
198
-
199
-
200
-
201
-
202
-
203
-
204
-
205
-
206
-
207
-
208
-
209
-
210
-
211
-
212
-
213
-
214
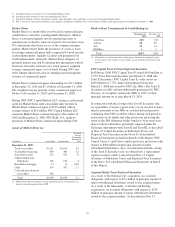
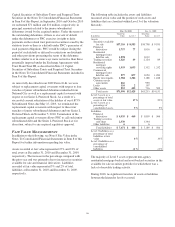
 |
 |
Regulation E related to overdraft fees and to be negatively
impacted by the potential limits related to interchange rates on
debit card transactions proposed in Dodd-Frank. The
incremental negative impact of these two aspects of regulatory
reform on fees may be approximately $400 million in 2011 if
limits to interchange rates are implemented consistent with
rules currently proposed by the Federal Reserve Board.
Changes in the proposed interchange rules could impact this
estimate. Further, this estimate does not include any additional
impact to revenue of other or additional regulatory
requirements. There could be other aspects of regulatory
reform that further impact these or other areas of our business
as regulatory agencies, including the new CFPB, issue
proposed and final regulations pursuant to Dodd-Frank and
other legislation. See additional information regarding
legislative and regulatory developments in the Executive
Summary section of this Item 7.
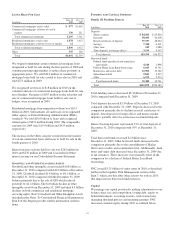
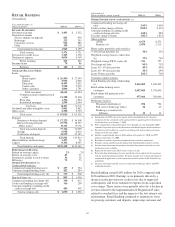
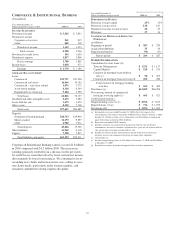
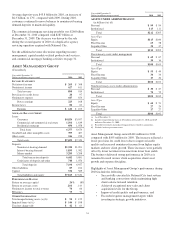
The provision for credit losses was $1.1 billion in 2010
compared with $1.3 billion in 2009. Net charge-offs were $1.1
billion in 2010 and essentially flat when compared with the
same period last year. These comparisons both benefited from
overall improved credit quality which was partially offset by
the previously mentioned consolidation of $1.6 billion in
credit card loans as of January 1, 2010. Credit quality has
shown signs of stabilization during 2010 with a declining net
charge-off trend in each of the last four quarters. The
improvement in net charge-off trends was predominately
driven by the small business commercial lending and credit
card portfolios. The increase in non-performing assets over the
prior year was primarily due to an increase in modified loans
reflecting continued efforts to work with borrowers
experiencing financial difficulties.
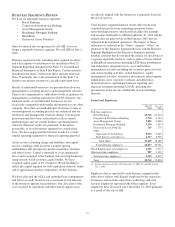
Noninterest expense for the year declined $115 million from
the same period last year. Expenses were well-managed as
continued investments in distribution channels were more than
offset by acquisition cost savings and the required branch
divestitures.
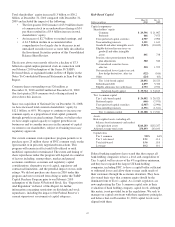
Growing core checking deposits as a lower-cost funding
source and as the cornerstone product to build customer
relationships is the primary objective of our deposit strategy.
Furthermore, core checking accounts are critical to our
strategy of expanding our payments business. The deposit
strategy of Retail Banking is to remain disciplined on pricing,
target specific products and markets for growth, and focus on
the retention and growth of balances for relationship
customers.
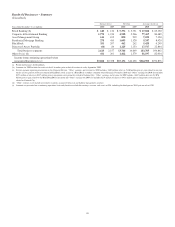
In 2010, average total deposits decreased $8.2 billion, or 6%,
compared with 2009.
• Average demand deposits increased $2.3 billion, or
7%, over 2009. The increase was primarily driven by
customer growth and customer preferences for
liquidity.
• Average money market deposits increased $731
million, or 2%, from 2009. The increase was
primarily due to core money market growth as
customers generally prefer more liquid deposits in a
low rate environment.
• In 2010, average certificates of deposit decreased
$11.6 billion from last year. This decline is expected
to continue in 2011, although at a slower pace, due to
the continued run off of higher rate certificates of
deposit that were primarily obtained through the
National City acquisition.
Currently, we plan to maintain our focus on a relationship-
based lending strategy that targets specific customer sectors
(mass consumers, homeowners, students, small businesses and
auto dealerships) and our moderate risk lending approach. In
2010, average total loans were $58.8 billion, an increase of
$2.1 billion, or 4%, over last year.
• Average education loans grew $2.9 billion compared
with 2009 primarily due to increases in federal loan
volumes as a result of non-bank competitors exiting
from the business, portfolio purchases, and the
impact of our current strategy of holding education
loans on the balance sheet. As previously noted, the
federally guaranteed portion of this business was
essentially eliminated going forward beginning
July 1, 2010 due to HCERA.
• Average credit card balances increased $1.7 billion
over 2009. The increase was primarily the result of
the consolidation of the securitized credit card
portfolio effective January 1, 2010.
• Average home equity loans declined $953 million
over 2009. Consumer loan demand remained soft in
the current economic climate. The decline is driven
by loan demand being outpaced by paydowns,
refinancings, and charge-offs. Retail Banking’s home
equity loan portfolio is relationship based, with 96%
of the portfolio attributable to borrowers in our
primary geographic footprint. The nonperforming
assets and charge-offs that we have experienced are
within our expectations given current market
conditions.
• Average commercial and commercial real estate
loans declined $1.1 billion compared with 2009. The
decline was primarily due to loan demand being
outpaced by refinancings, paydowns, charge-offs and
the required branch divestitures (approximately $0.2
billion of the decline on average).
51