PNC Bank 2010 Annual Report Download - page 145
Download and view the complete annual report
Please find page 145 of the 2010 PNC Bank annual report below. You can navigate through the pages in the report by either clicking on the pages listed below, or by using the keyword search tool below to find specific information within the annual report.-
 1
1 -
2
-
3
-
4
-
5
-
6
-
7
-
8
-
9
-
10
-
11
-
12
-
13
-
14
-
15
-
16
-
17
-
18
-
19
-
20
-
21
-
22
-
23
-
24
-
25
-
26
-
27
-
28
-
29
-
30
-
31
-
32
-
33
-
34
-
35
-
36
-
37
-
38
-
39
-
40
-
41
-
42
-
43
-
44
-
45
-
46
-
47
-
48
-
49
-
50
-
51
-
52
-
53
-
54
-
55
-
56
-
57
-
58
-
59
-
60
-
61
-
62
-
63
-
64
-
65
-
66
-
67
-
68
-
69
-
70
-
71
-
72
-
73
-
74
-
75
-
76
-
77
-
78
-
79
-
80
-
81
-
82
-
83
-
84
-
85
-
86
-
87
-
88
-
89
-
90
-
91
-
92
-
93
-
94
-
95
-
96
-
97
-
98
-
99
-
100
-
101
-
102
-
103
-
104
-
105
-
106
-
107
-
108
-
109
-
110
-
111
-
112
-
113
-
114
-
115
-
116
-
117
-
118
-
119
-
120
-
121
-
122
-
123
-
124
-
125
-
126
-
127
-
128
-
129
-
130
-
131
-
132
-
133
-
134
-
 135
135 -
 136
136 -
 137
137 -
 138
138 -
 139
139 -
 140
140 -
 141
141 -
 142
142 -
 143
143 -
 144
144 -
 145
145 -
 146
146 -
 147
147 -
 148
148 -
 149
149 -
 150
150 -
 151
151 -
 152
152 -
 153
153 -
 154
154 -
 155
155 -
156
-
157
-
158
-
159
-
160
-
161
-
162
-
163
-
164
-
165
-
166
-
167
-
168
-
169
-
170
-
171
-
172
-
173
-
174
-
175
-
176
-
177
-
178
-
179
-
180
-
181
-
182
-
183
-
184
-
185
-
186
-
187
-
188
-
189
-
190
-
191
-
192
-
193
-
194
-
195
-
196
-
197
-
198
-
199
-
200
-
201
-
202
-
203
-
204
-
205
-
206
-
207
-
208
-
209
-
210
-
211
-
212
-
213
-
214
 |
 |

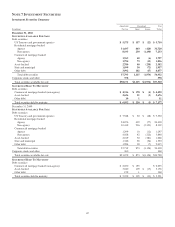
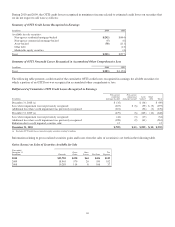
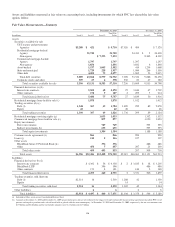
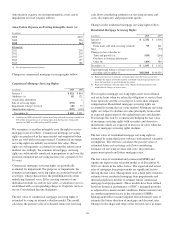
(c) Included in Loans held for sale on our Consolidated Balance Sheet. PNC has elected the fair value option for certain commercial and residential mortgage loans held for sale.
(d) Fair value includes net unrealized losses of $17 million at December 31, 2010 and net unrealized gains of $9 million at December 31, 2009.
(e) Interest income earned from trading securities totaled $40 million for 2010, $61 million for 2009, and $116 million for 2008. These amounts are included in other interest income on
the Consolidated Income Statement.
(f) Approximately 74% of these securities are US Treasury and government agencies securities at December 31, 2010.
(g) Included in Other intangible assets on our Consolidated Balance Sheet.
(h) The indirect equity funds are not redeemable, but PNC receives distributions over the life of the partnership from liquidation of the underlying investments by the investee.
(i) Included in Federal funds sold and resale agreements on our Consolidated Balance Sheet. PNC has elected the fair value option for these items.
(j) Included in Loans on our Consolidated Balance Sheet.
(k) PNC has elected the fair value option for these shares.
(l) Included in Other liabilities on our Consolidated Balance Sheet.
(m) Included in Other borrowed funds on our Consolidated Balance Sheet.
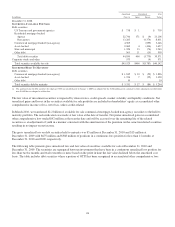
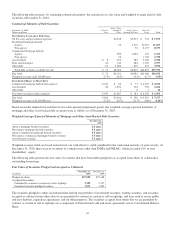
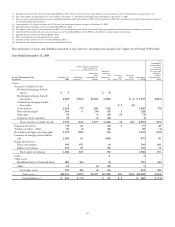
Reconciliations of assets and liabilities measured at fair value on a recurring basis using Level 3 inputs for 2010 and 2009 follow.
Year Ended December 31, 2010
Level 3 Instruments Only
In millions
Total realized / unrealized
gains or losses (a)
(*)
Attributable
to unrealized
gains or
losses related
to assets and
liabilities
held at
December 31,
2010
December 31,
2009
Included in
earnings (*)
Included in
other
comprehensive
income
Purchases,
issuances,
and
settlements,
net
Transfers
into
Level 3 (b)
Transfers
out of
Level 3 (b)
December
31, 2010
Assets
Securities available for sale
Residential mortgage-backed
agency $ 5 $ (5)
Residential mortgage-backed
non-agency 8,302 $(269) $1,218 (2,016) $ (2) $ 7,233 $(241)
Commercial mortgage-backed
non-agency 6 $ 2 (8)
Asset-backed 1,254 (77) 180 (312) 1,045 (78)
State and municipal 266 5 (24) (20) 1 228
Other debt 53 6 (15) 29 73
Corporate stocks and other 47 (1) (42) 4
Total securities available for sale 9,933 (341) 1,379 (2,410) 32 (10) 8,583 (319)
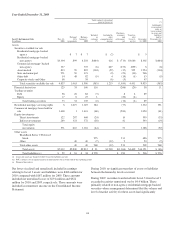
Financial derivatives 50 36 (10) 1 77 43
Trading securities – Debt 89 (2) (18) 69 (4)
Residential mortgage servicing rights 1,332 (209) (90) 1,033 (194)
Commercial mortgage loans held for
sale 1,050 16 (189) 877 20
Equity investments
Direct investments 595 157 (3) 749 102
Indirect investments 593 92 (50) 635 74
Total equity investments 1,188 249 (53) 1,384 176
Loans 22
Other assets
BlackRock Series C Preferred Stock 486 (86) (4) 396 (86)
Other 23 (4) (12) 7
Total other assets 509 (86) (4) (16) 403 (86)
Total assets $14,151 $(337) $1,375 $(2,784) $33 $(10) $12,428 $(364)
Total liabilities (c) $ 506 $ (71) $ 23 $ 2 $ 460 $ (73)
137