PNC Bank 2010 Annual Report Download - page 63
Download and view the complete annual report
Please find page 63 of the 2010 PNC Bank annual report below. You can navigate through the pages in the report by either clicking on the pages listed below, or by using the keyword search tool below to find specific information within the annual report.-
 1
1 -
2
-
3
-
4
-
5
-
6
-
7
-
8
-
9
-
10
-
11
-
12
-
13
-
14
-
15
-
16
-
17
-
18
-
19
-
20
-
21
-
22
-
23
-
24
-
25
-
26
-
27
-
28
-
29
-
30
-
31
-
32
-
33
-
34
-
35
-
36
-
37
-
38
-
39
-
40
-
41
-
42
-
43
-
44
-
45
-
46
-
47
-
48
-
49
-
50
-
51
-
52
-
 53
53 -
 54
54 -
 55
55 -
 56
56 -
 57
57 -
 58
58 -
 59
59 -
 60
60 -
 61
61 -
 62
62 -
 63
63 -
 64
64 -
 65
65 -
 66
66 -
 67
67 -
 68
68 -
 69
69 -
 70
70 -
 71
71 -
 72
72 -
 73
73 -
74
-
75
-
76
-
77
-
78
-
79
-
80
-
81
-
82
-
83
-
84
-
85
-
86
-
87
-
88
-
89
-
90
-
91
-
92
-
93
-
94
-
95
-
96
-
97
-
98
-
99
-
100
-
101
-
102
-
103
-
104
-
105
-
106
-
107
-
108
-
109
-
110
-
111
-
112
-
113
-
114
-
115
-
116
-
117
-
118
-
119
-
120
-
121
-
122
-
123
-
124
-
125
-
126
-
127
-
128
-
129
-
130
-
131
-
132
-
133
-
134
-
135
-
136
-
137
-
138
-
139
-
140
-
141
-
142
-
143
-
144
-
145
-
146
-
147
-
148
-
149
-
150
-
151
-
152
-
153
-
154
-
155
-
156
-
157
-
158
-
159
-
160
-
161
-
162
-
163
-
164
-
165
-
166
-
167
-
168
-
169
-
170
-
171
-
172
-
173
-
174
-
175
-
176
-
177
-
178
-
179
-
180
-
181
-
182
-
183
-
184
-
185
-
186
-
187
-
188
-
189
-
190
-
191
-
192
-
193
-
194
-
195
-
196
-
197
-
198
-
199
-
200
-
201
-
202
-
203
-
204
-
205
-
206
-
207
-
208
-
209
-
210
-
211
-
212
-
213
-
214
 |
 |
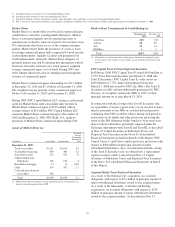
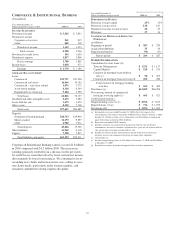
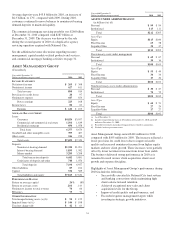
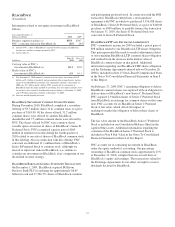
Assets under administration of $212 billion at December 31,
2010 increased $7 billion compared with the balance at
December 31, 2009. Discretionary assets under management
of $108 billion at December 31, 2010 increased $5 billion or 5
percent compared with the balance at December 31, 2009 due
to higher equity markets and strong sales performance.
Nondiscretionary assets under administration of $104 billion
increased $2 billion or 2 percent from 2009.
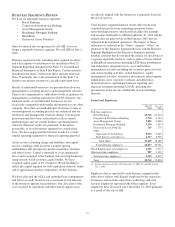
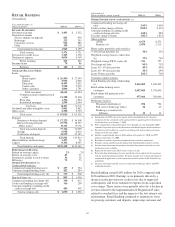
Total revenue for 2010 was $890 million compared with $919
million for 2009. Net interest income for 2010 decreased $45
million compared with 2009, primarily due to a reduction in
higher yield loans. Noninterest income of $627 million for
2010 increased $16 million compared with 2009 as the
impacts of strong sales results and the improved equity
markets were partially offset by the strategic exit of noncore
businesses.
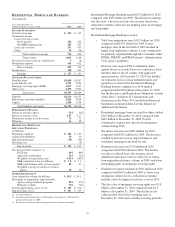
The provision for credit losses was $20 million for 2010
compared with $97 million for 2009. Net charge-offs were
$42 million for 2010 and $63 million for the 2009. Credit
quality showed signs of stabilization in 2010.
Noninterest expense of $647 million in 2010 decreased
slightly from 2009. The decline is attributable to disciplined
expense management and integration-related initiatives
partially offset by strategic investments in the business.
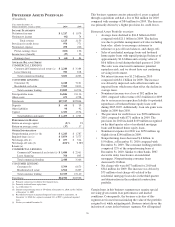
Total average deposits for 2010 increased $233 million, or
3%, from 2009 as a 10% increase in transaction deposits more
than offset the strategic exit of higher rate certificates of
deposit. Total average loans decreased $297 million, or 4%,
from 2009 as growth in consumer loans was more than offset
by a decline in other loan categories.
55