PNC Bank 2010 Annual Report Download - page 153
Download and view the complete annual report
Please find page 153 of the 2010 PNC Bank annual report below. You can navigate through the pages in the report by either clicking on the pages listed below, or by using the keyword search tool below to find specific information within the annual report.-
 1
1 -
2
-
3
-
4
-
5
-
6
-
7
-
8
-
9
-
10
-
11
-
12
-
13
-
14
-
15
-
16
-
17
-
18
-
19
-
20
-
21
-
22
-
23
-
24
-
25
-
26
-
27
-
28
-
29
-
30
-
31
-
32
-
33
-
34
-
35
-
36
-
37
-
38
-
39
-
40
-
41
-
42
-
43
-
44
-
45
-
46
-
47
-
48
-
49
-
50
-
51
-
52
-
53
-
54
-
55
-
56
-
57
-
58
-
59
-
60
-
61
-
62
-
63
-
64
-
65
-
66
-
67
-
68
-
69
-
70
-
71
-
72
-
73
-
74
-
75
-
76
-
77
-
78
-
79
-
80
-
81
-
82
-
83
-
84
-
85
-
86
-
87
-
88
-
89
-
90
-
91
-
92
-
93
-
94
-
95
-
96
-
97
-
98
-
99
-
100
-
101
-
102
-
103
-
104
-
105
-
106
-
107
-
108
-
109
-
110
-
111
-
112
-
113
-
114
-
115
-
116
-
117
-
118
-
119
-
120
-
121
-
122
-
123
-
124
-
125
-
126
-
127
-
128
-
129
-
130
-
131
-
132
-
133
-
134
-
135
-
136
-
137
-
138
-
139
-
140
-
141
-
142
-
 143
143 -
 144
144 -
 145
145 -
 146
146 -
 147
147 -
 148
148 -
 149
149 -
 150
150 -
 151
151 -
 152
152 -
 153
153 -
 154
154 -
 155
155 -
 156
156 -
 157
157 -
 158
158 -
 159
159 -
 160
160 -
 161
161 -
 162
162 -
 163
163 -
164
-
165
-
166
-
167
-
168
-
169
-
170
-
171
-
172
-
173
-
174
-
175
-
176
-
177
-
178
-
179
-
180
-
181
-
182
-
183
-
184
-
185
-
186
-
187
-
188
-
189
-
190
-
191
-
192
-
193
-
194
-
195
-
196
-
197
-
198
-
199
-
200
-
201
-
202
-
203
-
204
-
205
-
206
-
207
-
208
-
209
-
210
-
211
-
212
-
213
-
214
 |
 |

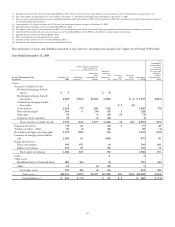
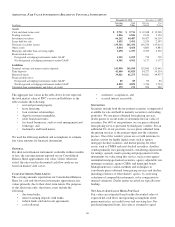
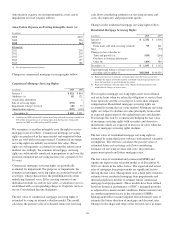
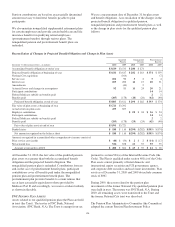
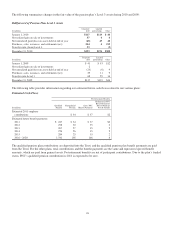
periods may result in volatility in the fair value estimate.
A sensitivity analysis of the hypothetical effect on the fair
value of MSRs to adverse changes in key assumptions is
presented below. These sensitivities do not include the impact
of the related hedging activities. Changes in fair value
generally cannot be extrapolated because the relationship of
the change in the assumption to the change in fair value may
not be linear. Also, the effect of a variation in a particular
assumption on the fair value of the MSRs is calculated
independently without changing any other assumption. In
reality, changes in one factor may result in changes in another
(for example, changes in mortgage interest rates, which drive
changes in prepayment rate estimates, could result in changes
in the interest rate spread), which could either magnify or
counteract the sensitivities.
The following tables set forth the sensitivity analysis of the
hypothetical effect on the fair value of MSRs to immediate
adverse changes of 10% and 20% in those assumptions:
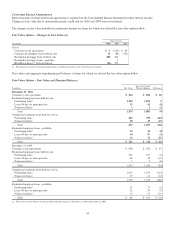
Commercial Mortgage Loan Servicing Assets – Key
Valuation Assumptions
Dollars in millions
Dec. 31,
2010
Dec. 31,
2009
Fair value $674 $1,020
Weighted-average life (years) 6.3 7.8
Weighted-average constant prepayment
rate 10%-24% 6%-19%
Decline in fair value from 10% adverse
change in prepayment rate $8.3 $9.7
Decline in fair value from 20% adverse
change in prepayment rate $15.9 $18.8
Spread over forward interest rate swap
rates 7%-9% 7%-9%
Decline in fair value from 10% adverse
change in interest rate $12.8 $24.6
Decline in fair value from 20% adverse
change in interest rate $25.6 $49.3
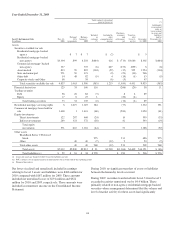
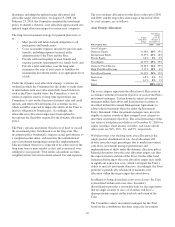
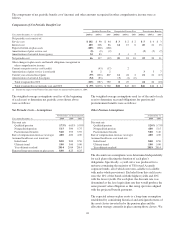
Residential Mortgage Loan Servicing Assets – Key Valuation
Assumptions
Dollars in millions
Dec. 31,
2010
Dec. 31,
2009
Fair value $1,033 $1,332
Weighted-average life (years) (a) 5.8 4.5
Weighted-average constant prepayment
rate (a) 12.61% 19.92%
Decline in fair value from 10% adverse change
in prepayment rate $34 $56
Decline in fair value from 20% adverse change
in prepayment rate $65 $109
Spread over forward interest rate swap rates 12.18% 12.16%
Decline in fair value from 10% adverse change
in interest rate $43 $55
Decline in fair value from 20% adverse change
in interest rate $83 $106
(a) Changes in weighted-average life and weighted-average constant prepayment rate
reflect the cumulative impact of changes in rates, prepayment expectations and
model changes.
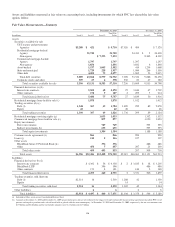
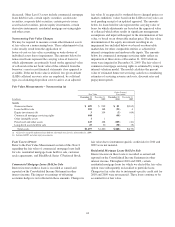
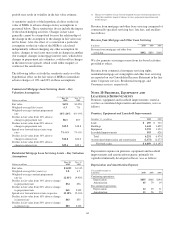
Revenue from mortgage and other loan servicing comprised of
contractually specified servicing fees, late fees, and ancillary
fees follows:
Revenue from Mortgage and Other Loan Servicing
In millions 2010 2009 2008
Revenue from mortgage and other loan
servicing $692 $825 $148
We also generate servicing revenue from fee-based activities
provided to others.
Revenue from commercial mortgage servicing rights,
residential mortgage servicing rights and other loan servicing
are reported on our Consolidated Income Statement in the line
items Corporate services, Residential mortgage, and
Consumer services, respectively.
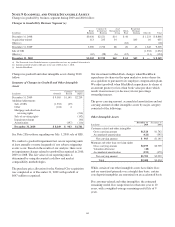
N
OTE
10 P
REMISES
,E
QUIPMENT AND
L
EASEHOLD
I
MPROVEMENTS
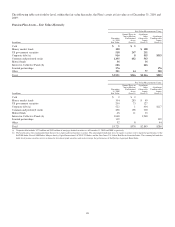
Premises, equipment and leasehold improvements, stated at
cost less accumulated depreciation and amortization, were as
follows:
Premises, Equipment and Leasehold Improvements
December 31 - in millions 2010 2009
Land $ 659 $ 733
Buildings 1,644 1,692
Equipment 3,335 3,423
Leasehold improvements 593 626
Total 6,231 6,474
Accumulated depreciation and amortization (2,172) (2,277)
Net book value $ 4,059 $ 4,197
Depreciation expense on premises, equipment and leasehold
improvements and amortization expense, primarily for
capitalized internally developed software, was as follows:
Depreciation and Amortization Expense
Year ended December 31
in millions 2010 2009 2008
Continuing operations:
Depreciation $455 $466 $194
Amortization 45 79 19
Discontinued operations:
Depreciation 12 29 31
Amortization 11 26 25
145