PNC Bank 2010 Annual Report Download - page 162
Download and view the complete annual report
Please find page 162 of the 2010 PNC Bank annual report below. You can navigate through the pages in the report by either clicking on the pages listed below, or by using the keyword search tool below to find specific information within the annual report.-
 1
1 -
2
-
3
-
4
-
5
-
6
-
7
-
8
-
9
-
10
-
11
-
12
-
13
-
14
-
15
-
16
-
17
-
18
-
19
-
20
-
21
-
22
-
23
-
24
-
25
-
26
-
27
-
28
-
29
-
30
-
31
-
32
-
33
-
34
-
35
-
36
-
37
-
38
-
39
-
40
-
41
-
42
-
43
-
44
-
45
-
46
-
47
-
48
-
49
-
50
-
51
-
52
-
53
-
54
-
55
-
56
-
57
-
58
-
59
-
60
-
61
-
62
-
63
-
64
-
65
-
66
-
67
-
68
-
69
-
70
-
71
-
72
-
73
-
74
-
75
-
76
-
77
-
78
-
79
-
80
-
81
-
82
-
83
-
84
-
85
-
86
-
87
-
88
-
89
-
90
-
91
-
92
-
93
-
94
-
95
-
96
-
97
-
98
-
99
-
100
-
101
-
102
-
103
-
104
-
105
-
106
-
107
-
108
-
109
-
110
-
111
-
112
-
113
-
114
-
115
-
116
-
117
-
118
-
119
-
120
-
121
-
122
-
123
-
124
-
125
-
126
-
127
-
128
-
129
-
130
-
131
-
132
-
133
-
134
-
135
-
136
-
137
-
138
-
139
-
140
-
141
-
142
-
143
-
144
-
145
-
146
-
147
-
148
-
149
-
150
-
151
-
 152
152 -
 153
153 -
 154
154 -
 155
155 -
 156
156 -
 157
157 -
 158
158 -
 159
159 -
 160
160 -
 161
161 -
 162
162 -
 163
163 -
 164
164 -
 165
165 -
 166
166 -
 167
167 -
 168
168 -
 169
169 -
 170
170 -
 171
171 -
 172
172 -
173
-
174
-
175
-
176
-
177
-
178
-
179
-
180
-
181
-
182
-
183
-
184
-
185
-
186
-
187
-
188
-
189
-
190
-
191
-
192
-
193
-
194
-
195
-
196
-
197
-
198
-
199
-
200
-
201
-
202
-
203
-
204
-
205
-
206
-
207
-
208
-
209
-
210
-
211
-
212
-
213
-
214
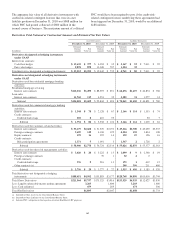
 |
 |

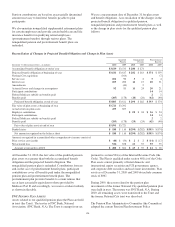
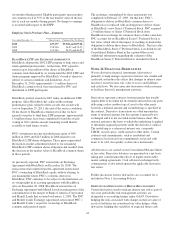
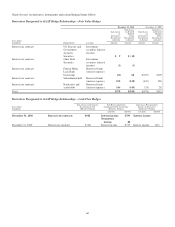
The following summarizes changes in the fair value of the pension plan’s Level 3 assets during 2010 and 2009:
Rollforward of Pension Plan Level 3 Assets
In millions
Corporate
debt
Limited
partnerships Other
January 1, 2010 $117 $119 $ 44
Net realized gain on sale of investments 37 6 4
Net unrealized gain/(loss) on assets held at end of year (48) 47 40
Purchases, sales, issuances, and settlements (net) 214 4 215
Transfers into (from) Level 3 33 (3)
December 31, 2010 $353 $176 $300
In millions
Corporate
debt
Limited
partnerships Other
January 1, 2009 $ 41 $ 55 $12
Net realized gain on sale of investments 2
Net unrealized gain/(loss) on assets held at end of year (23) (6) 9
Purchases, sales, issuances, and settlements (net) 29 11 9
Transfers into Level 3 68 59 14
December 31, 2009 $117 $119 $44
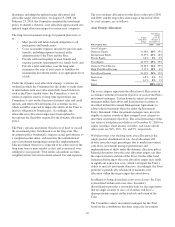
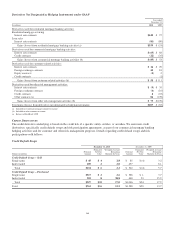
The following table provides information regarding our estimated future cash flows related to our various plans:
Estimated Cash Flows
Postretirement Benefits
In millions
Qualified
Pension
Nonqualified
Pension
Gross PNC
Benefit Payments
Reduction in PNC
Benefit Payments
Due to Medicare
Part D Subsidy
Estimated 2011 employer
contributions $ 34 $ 37 $2
Estimated future benefit payments
2011 $ 247 $ 34 $ 37 $2
2012 258 30 35 2
2013 267 27 35 2
2014 276 26 35 2
2015 284 25 35 2
2016 – 2020 1,541 105 166 8
The qualified pension plan contributions are deposited into the Trust, and the qualified pension plan benefit payments are paid
from the Trust. For the other plans, total contributions and the benefit payments are the same and represent expected benefit
amounts, which are paid from general assets. Postretirement benefits are net of participant contributions. Due to the plan’s funded
status, PNC’s qualified pension contribution in 2011 is expected to be zero.
154