PNC Bank 2010 Annual Report Download - page 195
Download and view the complete annual report
Please find page 195 of the 2010 PNC Bank annual report below. You can navigate through the pages in the report by either clicking on the pages listed below, or by using the keyword search tool below to find specific information within the annual report.-
 1
1 -
2
-
3
-
4
-
5
-
6
-
7
-
8
-
9
-
10
-
11
-
12
-
13
-
14
-
15
-
16
-
17
-
18
-
19
-
20
-
21
-
22
-
23
-
24
-
25
-
26
-
27
-
28
-
29
-
30
-
31
-
32
-
33
-
34
-
35
-
36
-
37
-
38
-
39
-
40
-
41
-
42
-
43
-
44
-
45
-
46
-
47
-
48
-
49
-
50
-
51
-
52
-
53
-
54
-
55
-
56
-
57
-
58
-
59
-
60
-
61
-
62
-
63
-
64
-
65
-
66
-
67
-
68
-
69
-
70
-
71
-
72
-
73
-
74
-
75
-
76
-
77
-
78
-
79
-
80
-
81
-
82
-
83
-
84
-
85
-
86
-
87
-
88
-
89
-
90
-
91
-
92
-
93
-
94
-
95
-
96
-
97
-
98
-
99
-
100
-
101
-
102
-
103
-
104
-
105
-
106
-
107
-
108
-
109
-
110
-
111
-
112
-
113
-
114
-
115
-
116
-
117
-
118
-
119
-
120
-
121
-
122
-
123
-
124
-
125
-
126
-
127
-
128
-
129
-
130
-
131
-
132
-
133
-
134
-
135
-
136
-
137
-
138
-
139
-
140
-
141
-
142
-
143
-
144
-
145
-
146
-
147
-
148
-
149
-
150
-
151
-
152
-
153
-
154
-
155
-
156
-
157
-
158
-
159
-
160
-
161
-
162
-
163
-
164
-
165
-
166
-
167
-
168
-
169
-
170
-
171
-
172
-
173
-
174
-
175
-
176
-
177
-
178
-
179
-
180
-
181
-
182
-
183
-
184
-
 185
185 -
 186
186 -
 187
187 -
 188
188 -
 189
189 -
 190
190 -
 191
191 -
 192
192 -
 193
193 -
 194
194 -
 195
195 -
 196
196 -
 197
197 -
 198
198 -
 199
199 -
 200
200 -
 201
201 -
 202
202 -
 203
203 -
 204
204 -
 205
205 -
206
-
207
-
208
-
209
-
210
-
211
-
212
-
213
-
214
 |
 |

S
TATISTICAL
I
NFORMATION
(U
NAUDITED
)
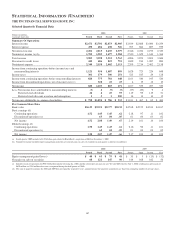
THE PNC FINANCIAL SERVICES GROUP, INC.
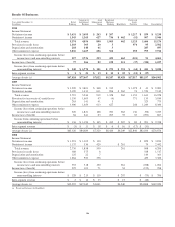
Selected Quarterly Financial Data
Dollars in millions,
except per share data
2010 2009
Fourth Third Second First Fourth Third Second First
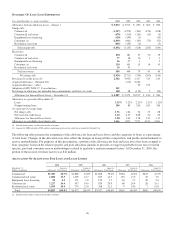
Summary Of Operations
Interest income $2,671 $2,701 $2,873 $2,905 $2,939 $2,888 $3,000 $3,259
Interest expense 470 486 438 526 593 664 807 939
Net interest income 2,201 2,215 2,435 2,379 2,346 2,224 2,193 2,320
Noninterest income (a) (b) 1,702 1,383 1,477 1,384 2,540 1,629 1,610 1,366
Total revenue 3,903 3,598 3,912 3,763 4,886 3,853 3,803 3,686
Provision for credit losses 442 486 823 751 1,049 914 1,087 880
Noninterest expense 2,340 2,158 2,002 2,113 2,209 2,214 2,492 2,158
Income from continuing operations before income taxes and
noncontrolling interests 1,121 954 1,087 899 1,628 725 224 648
Income taxes 301 179 306 251 525 185 29 128
Income from continuing operations before noncontrolling interests 820 775 781 648 1,103 540 195 520
Income from discontinued operations, net of income taxes (c) 328 22 23 4191210
Net income 820 1,103 803 671 1,107 559 207 530
Less: Net income (loss) attributable to noncontrolling interests (3) 2 (9) (5) (37) (20) 9 4
Preferred stock dividends 24 42593119 99 119 51
Preferred stock discount accretion and redemptions 13125014 13 14 15
Net income attributable to common shareholders $ 798 $1,094 $ 786 $ 333 $1,011 $ 467 $ 65 $ 460
Per Common Share Data
Book value $56.29 $55.91 $52.77 $50.32 $47.68 $45.52 $42.00 $41.67
Basic earnings (d)
Continuing operations 1.52 1.45 1.45 .62 2.18 .97 .11 1.02
Discontinued operations (c) .63 .04 .05 .01 .04 .03 .02
Net income 1.52 2.08 1.49 .67 2.19 1.01 .14 1.04
Diluted earnings (d)
Continuing operations 1.50 1.45 1.43 .61 2.16 .96 .11 1.01
Discontinued operations (c) .62 .04 .05 .01 .04 .03 .02
Net income 1.50 2.07 1.47 .66 2.17 1.00 .14 1.03
(a) Fourth quarter 2009 included a $1.076 billion gain related to BlackRock’s acquisition of BGI on December 1, 2009.
(b) Noninterest income included equity management gains/(losses) and net gains on sales of securities in each quarter as follows (in millions):
2010 2009
Fourth Third Second First Fourth Third Second First
Equity management gains/(losses) $40$63$75$41 $ 35 $ 3 $ (13) $ (52)
Net gains on sales of securities 68 121 147 90 144 168 182 56
(c) Includes results of operations for PNC Global Investment Servicing Inc. (GIS) and the related after-tax gain on sale. We sold GIS effective July 1, 2010, resulting in a pretax gain of
$639 million, or $328 million after taxes, recognized during the third quarter of 2010.
(d) The sum of quarterly amounts for 2010 and 2009 does not equal the respective year’s amount because the quarterly calculations are based on a changing number of average shares.
187