PNC Bank 2010 Annual Report Download - page 40
Download and view the complete annual report
Please find page 40 of the 2010 PNC Bank annual report below. You can navigate through the pages in the report by either clicking on the pages listed below, or by using the keyword search tool below to find specific information within the annual report.-
 1
1 -
2
-
3
-
4
-
5
-
6
-
7
-
8
-
9
-
10
-
11
-
12
-
13
-
14
-
15
-
16
-
17
-
18
-
19
-
20
-
21
-
22
-
23
-
24
-
25
-
26
-
27
-
28
-
29
-
 30
30 -
 31
31 -
 32
32 -
 33
33 -
 34
34 -
 35
35 -
 36
36 -
 37
37 -
 38
38 -
 39
39 -
 40
40 -
 41
41 -
 42
42 -
 43
43 -
 44
44 -
 45
45 -
 46
46 -
 47
47 -
 48
48 -
 49
49 -
 50
50 -
51
-
52
-
53
-
54
-
55
-
56
-
57
-
58
-
59
-
60
-
61
-
62
-
63
-
64
-
65
-
66
-
67
-
68
-
69
-
70
-
71
-
72
-
73
-
74
-
75
-
76
-
77
-
78
-
79
-
80
-
81
-
82
-
83
-
84
-
85
-
86
-
87
-
88
-
89
-
90
-
91
-
92
-
93
-
94
-
95
-
96
-
97
-
98
-
99
-
100
-
101
-
102
-
103
-
104
-
105
-
106
-
107
-
108
-
109
-
110
-
111
-
112
-
113
-
114
-
115
-
116
-
117
-
118
-
119
-
120
-
121
-
122
-
123
-
124
-
125
-
126
-
127
-
128
-
129
-
130
-
131
-
132
-
133
-
134
-
135
-
136
-
137
-
138
-
139
-
140
-
141
-
142
-
143
-
144
-
145
-
146
-
147
-
148
-
149
-
150
-
151
-
152
-
153
-
154
-
155
-
156
-
157
-
158
-
159
-
160
-
161
-
162
-
163
-
164
-
165
-
166
-
167
-
168
-
169
-
170
-
171
-
172
-
173
-
174
-
175
-
176
-
177
-
178
-
179
-
180
-
181
-
182
-
183
-
184
-
185
-
186
-
187
-
188
-
189
-
190
-
191
-
192
-
193
-
194
-
195
-
196
-
197
-
198
-
199
-
200
-
201
-
202
-
203
-
204
-
205
-
206
-
207
-
208
-
209
-
210
-
211
-
212
-
213
-
214
 |
 |
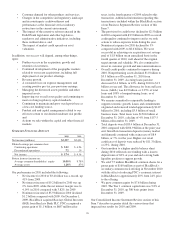
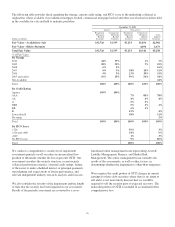
Service charges on deposits totaled $705 million for 2010 and
$950 million for 2009. The decrease in 2010 was due to lower
overdraft charges and required branch divestitures in the third
quarter of 2009. As further discussed in the Retail Banking
section of the Business Segments Review portion of this
Item 7, the new Regulation E rules related to overdraft charges
negatively impacted our 2010 revenue by approximately
$145 million.
Net gains on sales of securities were $426 million for 2010
and $550 million for 2009. OTTI credit losses on securities
recognized in earnings totaled $325 million in 2010 and $577
million in 2009. We expect the level of credit-related OTTI
charges to decline in 2011 compared with 2010.
Gains on BlackRock related transactions included a fourth
quarter 2010 pretax gain of $160 million from our sale of
7.5 million BlackRock common shares as part of a BlackRock
secondary common stock offering. During the fourth quarter
of 2009, we recognized a $1.1 billion pretax gain on PNC’s
portion of the increase in BlackRock’s equity resulting from
the value of BlackRock shares issued by BlackRock in
connection with its acquisition of BGI.
Other noninterest income totaled $884 million for 2010
compared with $987 million for 2009. Other noninterest
income for 2009 included gains of $103 million primarily
related to our BlackRock LTIP shares obligation. Other
noninterest income for 2010 included net gains on private
equity and alternative investments of $258 million, compared
with net losses on private equity and alternative investments
of $93 million in 2009. Gains on sales of loans were
$73 million in 2010 and $220 million in 2009.
Other noninterest income typically fluctuates from period to
period depending on the nature and magnitude of transactions
completed. Further details regarding our trading activities are
included in the Market Risk Management – Trading Risk
portion of the Risk Management section of this Item 7, further
details regarding private equity and alternative investments are
included in the Market Risk Management-Equity And Other
Investment Risk section, and further details regarding gains or
losses related to our equity investment in BlackRock are
included in the Business Segments Review section.
Looking to 2011, we see momentum in our fee-based revenues
resulting from client growth and depth in our expanded
franchise. At the same time, we will see the continued impact
of ongoing regulatory reforms. Excluding the expected
incremental negative impact of two aspects of anticipated
regulatory changes on fees related to Regulation E and
interchange rates of approximately $400 million in 2011 as
further discussed in the Retail Banking section of Business
Segments Review in this Item 7, we expect noninterest
income in 2011 to increase in the low-to-mid single digits
compared with 2010.
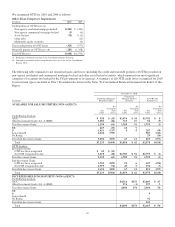
P
RODUCT
R
EVENUE
In addition to credit and deposit products for commercial
customers, Corporate & Institutional Banking offers other
services, including treasury management, commercial real
estate, and capital markets-related products and services that
are marketed by several businesses primarily to commercial
customers.
Treasury management revenue, which includes fees as well as
net interest income from customer deposit balances, totaled
$1.2 billion for 2010 and $1.1 billion for 2009. The increase
was primarily related to deposit growth and continued growth
in purchasing cards and lockbox as well as services provided
to the Federal government and healthcare customers.
Revenue from capital markets-related products and services
totaled $618 million in 2010 compared with $533 million in
2009. The increase was due to higher merger and acquisition
advisory, underwriting and syndications fees, partially offset by
lower gains on loan sales from portfolio management activities.
Commercial mortgage banking activities include revenue
derived from commercial mortgage servicing (including net
interest income and noninterest income from loan servicing
and ancillary services), and revenue derived from commercial
mortgage loans intended for sale and related hedges (including
loan origination fees, net interest income, valuation
adjustments and gains or losses on sales).
Commercial mortgage banking activities resulted in revenue
of $262 million in 2010 compared with $485 million in 2009.
This decline was primarily due to sales of servicing and a
decrease in the net carrying amount of commercial mortgage
servicing rights. These decreases were partially offset by
higher ancillary commercial mortgage servicing fees.
P
ROVISION
F
OR
C
REDIT
L
OSSES
The provision for credit losses totaled $2.5 billion for 2010
compared with $3.9 billion for 2009. The lower provision in
2010 reflected credit exposure reductions and overall
improved credit migration during 2010.
We anticipate an overall improvement in credit migration in
2011 and a continued reduction in our nonperforming loans
assuming modest GDP growth. As a result, we expect that our
average quarterly provision for credit losses in 2011 to be less
than the fourth quarter 2010 provision for credit losses of
$442 million, assuming budgeted loan growth projections. If
our expectations hold, this would result in our full year 2011
provision for credit losses to be at least $800 million less than
our full year 2010 provision for credit losses.
The Credit Risk Management portion of the Risk Management
section of this Item 7 includes additional information regarding
factors impacting the provision for credit losses. See also
Item 1A Risk Factors and the Cautionary Statement Regarding
Forward-Looking Information section of Item 7 of this Report.
32