PNC Bank 2010 Annual Report Download - page 57
Download and view the complete annual report
Please find page 57 of the 2010 PNC Bank annual report below. You can navigate through the pages in the report by either clicking on the pages listed below, or by using the keyword search tool below to find specific information within the annual report.-
 1
1 -
2
-
3
-
4
-
5
-
6
-
7
-
8
-
9
-
10
-
11
-
12
-
13
-
14
-
15
-
16
-
17
-
18
-
19
-
20
-
21
-
22
-
23
-
24
-
25
-
26
-
27
-
28
-
29
-
30
-
31
-
32
-
33
-
34
-
35
-
36
-
37
-
38
-
39
-
40
-
41
-
42
-
43
-
44
-
45
-
46
-
 47
47 -
 48
48 -
 49
49 -
 50
50 -
 51
51 -
 52
52 -
 53
53 -
 54
54 -
 55
55 -
 56
56 -
 57
57 -
 58
58 -
 59
59 -
 60
60 -
 61
61 -
 62
62 -
 63
63 -
 64
64 -
 65
65 -
 66
66 -
 67
67 -
68
-
69
-
70
-
71
-
72
-
73
-
74
-
75
-
76
-
77
-
78
-
79
-
80
-
81
-
82
-
83
-
84
-
85
-
86
-
87
-
88
-
89
-
90
-
91
-
92
-
93
-
94
-
95
-
96
-
97
-
98
-
99
-
100
-
101
-
102
-
103
-
104
-
105
-
106
-
107
-
108
-
109
-
110
-
111
-
112
-
113
-
114
-
115
-
116
-
117
-
118
-
119
-
120
-
121
-
122
-
123
-
124
-
125
-
126
-
127
-
128
-
129
-
130
-
131
-
132
-
133
-
134
-
135
-
136
-
137
-
138
-
139
-
140
-
141
-
142
-
143
-
144
-
145
-
146
-
147
-
148
-
149
-
150
-
151
-
152
-
153
-
154
-
155
-
156
-
157
-
158
-
159
-
160
-
161
-
162
-
163
-
164
-
165
-
166
-
167
-
168
-
169
-
170
-
171
-
172
-
173
-
174
-
175
-
176
-
177
-
178
-
179
-
180
-
181
-
182
-
183
-
184
-
185
-
186
-
187
-
188
-
189
-
190
-
191
-
192
-
193
-
194
-
195
-
196
-
197
-
198
-
199
-
200
-
201
-
202
-
203
-
204
-
205
-
206
-
207
-
208
-
209
-
210
-
211
-
212
-
213
-
214
 |
 |

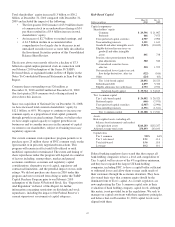
R
ETAIL
B
ANKING
(Unaudited)
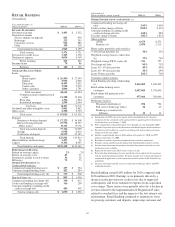
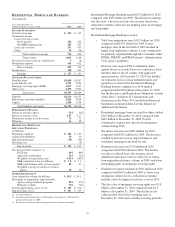
Year ended December 31
Dollars in millions 2010 (a) 2009 (b)
I
NCOME
S
TATEMENT
Net interest income $ 3,433 $ 3,522
Noninterest income
Service charges on deposits 681 930
Brokerage 212 245
Consumer services 912 886
Other 138 138
Total noninterest income 1,943 2,199
Total revenue 5,376 5,721
Provision for credit losses 1,103 1,330
Noninterest expense 4,054 4,169
Pretax earnings 219 222
Income taxes 79 86
Earnings $ 140 $ 136
A
VERAGE
B
ALANCE
S
HEET
Loans
Consumer
Home equity $ 26,450 $ 27,403
Indirect 3,973 4,036
Education 8,497 5,625
Credit cards 3,938 2,239
Other consumer 1,804 1,791
Total consumer 44,662 41,094
Commercial and commercial real
estate 11,208 12,306
Floor plan 1,336 1,264
Residential mortgage 1,599 2,064
Total loans 58,805 56,728
Goodwill and other intangible assets 5,861 5,842
Other assets 2,358 2,750
Total assets $ 67,024 $ 65,320
Deposits
Noninterest-bearing demand $ 17,223 $ 16,308
Interest-bearing demand 19,776 18,357
Money market 40,125 39,394
Total transaction deposits 77,124 74,059
Savings 6,938 6,610
Certificates of deposit 41,539 53,145
Total deposits 125,601 133,814
Other liabilities and borrowings 1,477 51
Capital 8,132 8,497
Total liabilities and equity $135,210 $142,362
P
ERFORMANCE
R
ATIOS
Return on average capital 2% 2%
Return on average assets .21 .21
Noninterest income to total revenue 36 38
Efficiency 75 73
O
THER
I
NFORMATION
(
C
)
Credit-related statistics:
Commercial nonperforming assets $ 297 $ 324
Consumer nonperforming assets 422 284
Total nonperforming assets (d) $ 719 $ 608
Impaired loans (e) $ 895 $ 1,056
Commercial lending net charge-offs $ 330 $ 415
Credit card lending net charge-offs 316 209
Consumer lending (excluding credit
card) net charge-offs 424 402
Total net charge-offs $ 1,070 $ 1,026
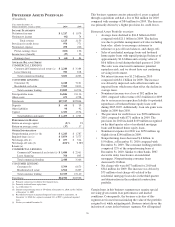
At December 31
Dollars in millions, except as noted 2010 (a) 2009(b)
O
THER
I
NFORMATION
(
CONTINUED
)(c)
Commercial lending net charge-off
ratio 2.63% 3.06%
Credit card net charge-off ratio 8.02% 9.33%
Consumer lending (excluding credit
card) net charge-off ratio 1.00% .98%
Total net charge-off ratio 1.82% 1.81%
Other statistics:
ATMs 6,673 6,473
Branches (f) 2,470 2,513
Home equity portfolio credit statistics:
% of first lien positions (g) 36% 35%
Weighted average loan-to-value ratios
(g) 73% 74%
Weighted average FICO scores (h) 726 727
Net charge-off ratio .90% .75%
Loans 30 – 59 days past due .49% .49%
Loans 60 – 89 days past due .30% .29%
Loans 90 days past due 1.02% .76%
Customer-related statistics:
Retail Banking checking relationships
(i) 5,465,000 5,390,000
Retail online banking active
customers 3,057,000 2,743,000
Retail online bill payment active
customers 977,000 780,000
Brokerage statistics:
Financial consultants (j) 694 704
Full service brokerage offices 34 40
Brokerage account assets
(billions) $33$32
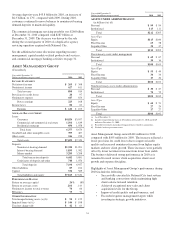
(a) Information for 2010 reflects the impact of the consolidation in our financial
statements for the securitized credit card portfolio of approximately $1.6 billion of
credit card loans as of January 1, 2010.
(b) PNC completed the required divestiture of 61 branches in early September 2009.
Amounts for periods prior to the divestitures include the impact of those branches.
(c) Presented as of December 31 except for net charge-offs and net charge-off ratios,
which are for the year ended.
(d) Includes nonperforming loans of $694 million at December 31, 2010 and $597
million at December 31, 2009.
(e) Recorded investment of purchased impaired loans related to acquisitions.
(f) Excludes certain satellite branches that provide limited products and/or services.
(g) Includes loans from acquired portfolios for which lien position and loan-to-value
information is not available.
(h) Represents the most recent FICO scores we have on file.
(i) Retail checking relationships for prior periods have been adjusted to be consistent
with the current period presentation. The prior amounts were refined subsequent to
completion of application system conversion activities related to the National City
acquisition.
(j) Financial consultants provide services in full service brokerage offices and PNC
traditional branches.
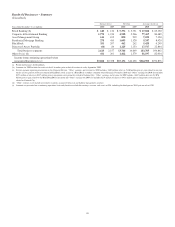
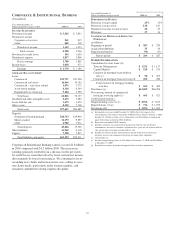
Retail Banking earned $140 million for 2010 compared with
$136 million in 2009. Earnings were primarily driven by a
decrease in the provision for credit losses due to improved
credit quality and lower noninterest expense from acquisition
cost savings. These factors were partially offset by a decline in
revenue related to the implementation of Regulation E rules
related to overdraft fees and the impact of the low interest rate
environment. Retail Banking continued to maintain its focus
on growing customers and deposits, improving customer and
49