PNC Bank 2010 Annual Report Download - page 32
Download and view the complete annual report
Please find page 32 of the 2010 PNC Bank annual report below. You can navigate through the pages in the report by either clicking on the pages listed below, or by using the keyword search tool below to find specific information within the annual report.-
 1
1 -
2
-
3
-
4
-
5
-
6
-
7
-
8
-
9
-
10
-
11
-
12
-
13
-
14
-
15
-
16
-
17
-
18
-
19
-
20
-
21
-
 22
22 -
 23
23 -
 24
24 -
 25
25 -
 26
26 -
 27
27 -
 28
28 -
 29
29 -
 30
30 -
 31
31 -
 32
32 -
 33
33 -
 34
34 -
 35
35 -
 36
36 -
 37
37 -
 38
38 -
 39
39 -
 40
40 -
 41
41 -
 42
42 -
43
-
44
-
45
-
46
-
47
-
48
-
49
-
50
-
51
-
52
-
53
-
54
-
55
-
56
-
57
-
58
-
59
-
60
-
61
-
62
-
63
-
64
-
65
-
66
-
67
-
68
-
69
-
70
-
71
-
72
-
73
-
74
-
75
-
76
-
77
-
78
-
79
-
80
-
81
-
82
-
83
-
84
-
85
-
86
-
87
-
88
-
89
-
90
-
91
-
92
-
93
-
94
-
95
-
96
-
97
-
98
-
99
-
100
-
101
-
102
-
103
-
104
-
105
-
106
-
107
-
108
-
109
-
110
-
111
-
112
-
113
-
114
-
115
-
116
-
117
-
118
-
119
-
120
-
121
-
122
-
123
-
124
-
125
-
126
-
127
-
128
-
129
-
130
-
131
-
132
-
133
-
134
-
135
-
136
-
137
-
138
-
139
-
140
-
141
-
142
-
143
-
144
-
145
-
146
-
147
-
148
-
149
-
150
-
151
-
152
-
153
-
154
-
155
-
156
-
157
-
158
-
159
-
160
-
161
-
162
-
163
-
164
-
165
-
166
-
167
-
168
-
169
-
170
-
171
-
172
-
173
-
174
-
175
-
176
-
177
-
178
-
179
-
180
-
181
-
182
-
183
-
184
-
185
-
186
-
187
-
188
-
189
-
190
-
191
-
192
-
193
-
194
-
195
-
196
-
197
-
198
-
199
-
200
-
201
-
202
-
203
-
204
-
205
-
206
-
207
-
208
-
209
-
210
-
211
-
212
-
213
-
214
 |
 |

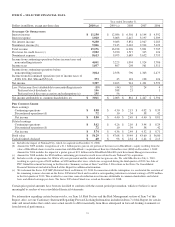
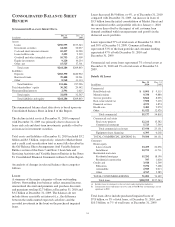
At or for the year ended December 31
Dollars in millions, except as noted 2010 (a) 2009 (a) 2008 (b) 2007 2006
B
ALANCE
S
HEET
H
IGHLIGHTS
Assets $264,284 $269,863 $291,081 $138,920 $101,820
Loans 150,595 157,543 175,489 68,319 50,105
Allowance for loan and lease losses 4,887 5,072 3,917 830 560
Interest-earning deposits with banks 1,610 4,488 14,859 346 339
Investment securities 64,262 56,027 43,473 30,225 23,191
Loans held for sale 3,492 2,539 4,366 3,927 2,366
Goodwill and other intangible assets 10,753 12,909 11,688 9,551 4,043
Equity investments 9,220 10,254 8,554 6,045 5,330
Noninterest-bearing deposits 50,019 44,384 37,148 19,440 16,070
Interest-bearing deposits 133,371 142,538 155,717 63,256 50,231
Total deposits 183,390 186,922 192,865 82,696 66,301
Borrowed funds (c) 39,488 39,261 52,240 30,931 15,028
Total shareholders’ equity 30,242 29,942 25,422 14,854 10,788
Common shareholders’ equity 29,596 22,011 17,490 14,847 10,781
A
SSETS
U
NDER
A
DMINISTRATION
(billions)
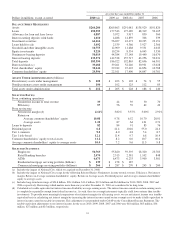
Discretionary assets under management $ 108 $ 103 $ 103 $ 74 $ 55
Nondiscretionary assets under management 104 102 125 112 85
Total assets under administration $ 212 $ 205 $ 228 $ 186 $ 140
S
ELECTED
R
ATIOS
From continuing operations
Noninterest income to total revenue 39 44 39 50 70
Efficiency 57 56 59 62 49
From net income
Net interest margin (d) 4.14% 3.82% 3.37% 3.00% 2.92%
Return on
Average common shareholders’ equity 10.88 9.78 6.52 10.70 28.01
Average assets 1.28 .87 .64 1.21 2.74
Loans to deposits 82 84 91 83 76
Dividend payout 6.8 21.4 104.6 55.0 24.4
Tier 1 common 9.8 6.0 4.8 5.4 8.7
Tier 1 risk-based 12.1 11.4 9.7 6.8 10.4
Common shareholders’ equity to total assets 11.2 8.2 6.0 10.7 10.6
Average common shareholders’ equity to average assets 10.4 7.2 9.6 11.3 9.8
S
ELECTED
S
TATISTICS
Employees 50,769 55,820 59,595 28,320 23,783
Retail Banking branches 2,470 2,513 2,581 1,102 848
ATMs 6,673 6,473 6,233 3,900 3,581
Residential mortgage servicing portfolio (billions) $ 139 $ 158 $ 187
Commercial mortgage servicing portfolio (billions) $ 266 $ 287 $ 270 $ 243 $ 200
(a) Includes the impact of National City, which we acquired on December 31, 2008.
(b) Includes the impact of National City except for the following Selected Ratios: Noninterest income to total revenue, Efficiency, Net interest
margin, Return on Average common shareholders’ equity, Return on Average assets, Dividend payout, and Average common shareholders’
equity to average assets.
(c) Includes long-term borrowings of $24.8 billion, $26.3 billion, $33.6 billion, $12.6 billion and $6.6 billion for 2010, 2009, 2008, 2007 and
2006, respectively. Borrowings which mature more than one year after December 31, 2010 are considered to be long-term.
(d) Calculated as taxable-equivalent net interest income divided by average earning assets. The interest income earned on certain earning assets
is completely or partially exempt from federal income tax. As such, these tax-exempt instruments typically yield lower returns than taxable
investments. To provide more meaningful comparisons of net interest margins for all earning assets, we use net interest income on a taxable-
equivalent basis in calculating net interest margin by increasing the interest income earned on tax-exempt assets to make it fully equivalent to
interest income earned on taxable investments. This adjustment is not permitted under GAAP on the Consolidated Income Statement. The
taxable-equivalent adjustments to net interest income for the years 2010, 2009, 2008, 2007 and 2006 were $81 million, $65 million, $36
million, $27 million and $25 million, respectively.
24