PNC Bank 2010 Annual Report Download - page 198
Download and view the complete annual report
Please find page 198 of the 2010 PNC Bank annual report below. You can navigate through the pages in the report by either clicking on the pages listed below, or by using the keyword search tool below to find specific information within the annual report.-
 1
1 -
2
-
3
-
4
-
5
-
6
-
7
-
8
-
9
-
10
-
11
-
12
-
13
-
14
-
15
-
16
-
17
-
18
-
19
-
20
-
21
-
22
-
23
-
24
-
25
-
26
-
27
-
28
-
29
-
30
-
31
-
32
-
33
-
34
-
35
-
36
-
37
-
38
-
39
-
40
-
41
-
42
-
43
-
44
-
45
-
46
-
47
-
48
-
49
-
50
-
51
-
52
-
53
-
54
-
55
-
56
-
57
-
58
-
59
-
60
-
61
-
62
-
63
-
64
-
65
-
66
-
67
-
68
-
69
-
70
-
71
-
72
-
73
-
74
-
75
-
76
-
77
-
78
-
79
-
80
-
81
-
82
-
83
-
84
-
85
-
86
-
87
-
88
-
89
-
90
-
91
-
92
-
93
-
94
-
95
-
96
-
97
-
98
-
99
-
100
-
101
-
102
-
103
-
104
-
105
-
106
-
107
-
108
-
109
-
110
-
111
-
112
-
113
-
114
-
115
-
116
-
117
-
118
-
119
-
120
-
121
-
122
-
123
-
124
-
125
-
126
-
127
-
128
-
129
-
130
-
131
-
132
-
133
-
134
-
135
-
136
-
137
-
138
-
139
-
140
-
141
-
142
-
143
-
144
-
145
-
146
-
147
-
148
-
149
-
150
-
151
-
152
-
153
-
154
-
155
-
156
-
157
-
158
-
159
-
160
-
161
-
162
-
163
-
164
-
165
-
166
-
167
-
168
-
169
-
170
-
171
-
172
-
173
-
174
-
175
-
176
-
177
-
178
-
179
-
180
-
181
-
182
-
183
-
184
-
185
-
186
-
187
-
 188
188 -
 189
189 -
 190
190 -
 191
191 -
 192
192 -
 193
193 -
 194
194 -
 195
195 -
 196
196 -
 197
197 -
 198
198 -
 199
199 -
 200
200 -
 201
201 -
 202
202 -
 203
203 -
 204
204 -
 205
205 -
 206
206 -
 207
207 -
 208
208 -
209
-
210
-
211
-
212
-
213
-
214
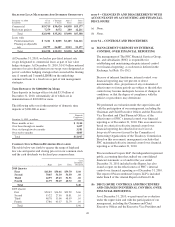
 |
 |

L
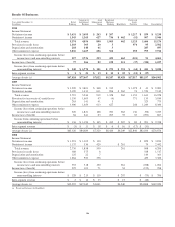
OANS
O
UTSTANDING
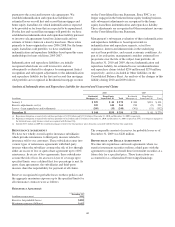
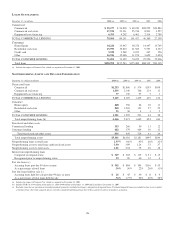
December 31 - in millions 2010 (a) 2009 (a) 2008 (a) 2007 2006
Commercial
Commercial $ 55,177 $ 54,818 $ 69,220 $28,952 $20,883
Commercial real estate 17,934 23,131 25,736 8,903 3,527
Equipment lease financing 6,393 6,202 6,461 2,514 2,789
TOTAL COMMERCIAL LENDING 79,504 84,151 101,417 40,369 27,199
Consumer
Home Equity 34,226 35,947 38,276 14,447 13,749
Residential real estate 15,999 19,810 21,583 9,557 6,337
Credit card 3,920 2,569 2,237 247 126
Other 16,946 15,066 11,976 3,699 2,694
TOTAL CONSUMER LENDING 71,091 73,392 74,072 27,950 22,906
Total loans $150,595 $157,543 $175,489 $68,319 $50,105
(a) Includes the impact of National City, which we acquired on December 31, 2008.
N
ONPERFORMING
A
SSETS AND
R
ELATED
I
NFORMATION
December 31 - dollars in millions 2010 (a) 2009 (a) 2008 (a) 2007 2006
Nonaccrual loans
Commercial $1,253 $1,806 $ 576 $193 $109
Commercial real estate 1,835 2,140 766 214 12
Equipment lease financing 77 130 97 3 1
TOTAL COMMERCIAL LENDING 3,165 4,076 1,439 410 122
Consumer
Home equity 448 356 66 16 11
Residential real estate 818 1,203 153 27 25
Other 35 36 412
TOTAL CONSUMER LENDING 1,301 1,595 223 44 38
Total nonperforming loans (b) 4,466 5,671 1,662 454 160
Foreclosed and other assets
Commercial lending 353 266 50 11 12
Consumer lending 482 379 469 30 12
Total foreclosed and other assets 835 645 519 41 24
Total nonperforming assets $5,301 $6,316 $2,181 $495 $184
Nonperforming loans to total loans 2.97% 3.60% .95% .66% .32%
Nonperforming assets to total loans and foreclosed assets 3.50 3.99 1.24 .72 .37
Nonperforming assets to total assets 2.01 2.34 .75 .36 .18
Interest on nonperforming loans
Computed on original terms $ 329 $ 302 $ 115 $ 51 $ 15
Recognized prior to nonperforming status 53 90 60 32 4
Past due loans (c)
Accruing loans past due 90 days or more $ 542 $ 884 $ 395 $136 $ 55
As a percentage of total loans .36% .56% .22% .20% .11%
Past due loans held for sale (c)
Accruing loans held for sale past due 90 days or more $26 $ 45 $ 40 $8 $9
As a percentage of total loans held for sale .76% 1.77% .92% .20% .38%
(a) Includes the impact of National City, which we acquired on December 31, 2008.
(b) Includes TDRs of $784 million at December 31, 2010, $440 million at December 31, 2009 and $2 million at December 31, 2007.
(c) Excludes loans that are government insured/guaranteed, primarily residential mortgages, and purchased impaired loans. Purchased impaired loans are excluded as they were recorded
at estimated fair value when acquired and are currently considered performing loans due to the accretion of interest in purchase accounting.
190