PNC Bank 2010 Annual Report Download - page 66
Download and view the complete annual report
Please find page 66 of the 2010 PNC Bank annual report below. You can navigate through the pages in the report by either clicking on the pages listed below, or by using the keyword search tool below to find specific information within the annual report.-
 1
1 -
2
-
3
-
4
-
5
-
6
-
7
-
8
-
9
-
10
-
11
-
12
-
13
-
14
-
15
-
16
-
17
-
18
-
19
-
20
-
21
-
22
-
23
-
24
-
25
-
26
-
27
-
28
-
29
-
30
-
31
-
32
-
33
-
34
-
35
-
36
-
37
-
38
-
39
-
40
-
41
-
42
-
43
-
44
-
45
-
46
-
47
-
48
-
49
-
50
-
51
-
52
-
53
-
54
-
55
-
 56
56 -
 57
57 -
 58
58 -
 59
59 -
 60
60 -
 61
61 -
 62
62 -
 63
63 -
 64
64 -
 65
65 -
 66
66 -
 67
67 -
 68
68 -
 69
69 -
 70
70 -
 71
71 -
 72
72 -
 73
73 -
 74
74 -
 75
75 -
 76
76 -
77
-
78
-
79
-
80
-
81
-
82
-
83
-
84
-
85
-
86
-
87
-
88
-
89
-
90
-
91
-
92
-
93
-
94
-
95
-
96
-
97
-
98
-
99
-
100
-
101
-
102
-
103
-
104
-
105
-
106
-
107
-
108
-
109
-
110
-
111
-
112
-
113
-
114
-
115
-
116
-
117
-
118
-
119
-
120
-
121
-
122
-
123
-
124
-
125
-
126
-
127
-
128
-
129
-
130
-
131
-
132
-
133
-
134
-
135
-
136
-
137
-
138
-
139
-
140
-
141
-
142
-
143
-
144
-
145
-
146
-
147
-
148
-
149
-
150
-
151
-
152
-
153
-
154
-
155
-
156
-
157
-
158
-
159
-
160
-
161
-
162
-
163
-
164
-
165
-
166
-
167
-
168
-
169
-
170
-
171
-
172
-
173
-
174
-
175
-
176
-
177
-
178
-
179
-
180
-
181
-
182
-
183
-
184
-
185
-
186
-
187
-
188
-
189
-
190
-
191
-
192
-
193
-
194
-
195
-
196
-
197
-
198
-
199
-
200
-
201
-
202
-
203
-
204
-
205
-
206
-
207
-
208
-
209
-
210
-
211
-
212
-
213
-
214
 |
 |

D
ISTRESSED
A
SSETS
P
ORTFOLIO
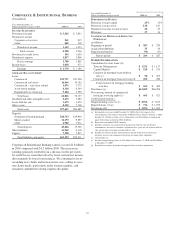
(Unaudited)
Year ended December 31
Dollars in millions, except as noted 2010 2009
I
NCOME
S
TATEMENT
Net interest income $ 1,217 $ 1,079
Noninterest income (92) 74
Total revenue 1,125 1,153
Provision for credit losses 976 771
Noninterest expense 250 246
Pretax earnings (loss) (101) 136
Income taxes (benefit) (37) 52
Earnings (loss) $ (64) $84
A
VERAGE
B
ALANCE
S
HEET
COMMERCIAL LENDING:
Commercial/Commercial real estate (a) $ 2,240 $ 3,384
Lease financing 781 818
Total commercial lending 3,021 4,202
CONSUMER LENDING:
Consumer (b) 6,240 7,101
Residential real estate 7,585 9,813
Total consumer lending 13,825 16,914
Total portfolio loans 16,846 21,116
Other assets 671 1,728
Total assets $17,517 $22,844
Deposits $64 $39
Other liabilities 90 92
Capital 1,321 1,574
Total liabilities and equity $ 1,475 $ 1,705
P
ERFORMANCE
R
ATIOS
Return on average capital (5)% 5%
Return on average assets (.37) .37
O
THER
I
NFORMATION
Nonperforming assets (c) (d) $ 1,243 $ 1,787
Impaired loans (c) (e) $ 5,879 $ 7,577
Net charge-offs (f) $ 677 $ 544
Net charge-off ratio (f) 4.02% 2.58%
L
OANS
(c)
COMMERCIAL LENDING
Commercial/Commercial real estate (a) $ 1,684 $ 2,561
Lease financing 764 805
Total commercial lending 2,448 3,366
CONSUMER LENDING
Consumer (b) 5,769 6,673
Residential real estate 6,564 8,467
Total consumer lending 12,333 15,140
Total loans $14,781 $18,506
(a) Primarily commercial residential development loans.
(b) Primarily brokered home equity loans.
(c) As of December 31.
(d) Includes nonperforming loans of $.9 billion at December 31, 2010 and $1.5 billion
at December 31, 2009.
(e) Recorded investment of purchased impaired loans related to acquisitions. At
December 31, 2010, this segment contained 76% of PNC’s purchased impaired
loans.
(f) For the year ended December 31.
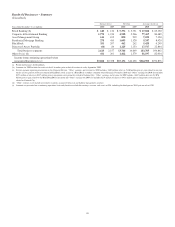
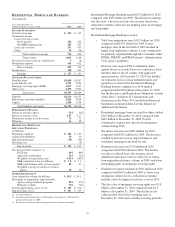
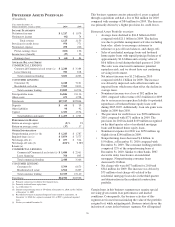
This business segment consists primarily of assets acquired
through acquisitions and had a loss of $64 million for 2010
compared with earnings of $84 million for 2009. The decrease
was primarily driven by a higher provision for credit losses.
Distressed Assets Portfolio overview:
• Average loans declined to $16.8 billion in 2010
compared with $21.1 billion in 2009. The decline
was due to portfolio management activities including
loan sales, efforts to encourage customers to
refinance or pay off loan balances, and charge-offs.
• Sales of residential mortgage loans and brokered
home equity loans with unpaid principal balances of
approximately $1.6 billion and carrying value of
$0.6 billion closed during the third quarter of 2010.
The sales were structured to minimize potential
repurchase risk, and we do not have any continuing
servicing involvement.
• Net interest income was $1.2 billion in 2010
compared with $1.1 billion for 2009. The increase
was driven by improved cash collection results on
impaired loans which more than offset the decline in
average loans.
• Noninterest income was a loss of $92 million for
2010 compared with revenue of $74 million for 2009
due to an increase in repurchase liability for potential
repurchases of brokered home equity loans sold
during 2005-2007. Additionally, loan sale gains were
higher in 2009 than 2010.
• The provision for credit losses was $976 million in
2010 compared with $771 million in 2009. The
provision for 2010 included $109 million recognized
on the third quarter sales of residential mortgage
loans and brokered home equity loans.
• Noninterest expense for 2010 was $250 million, up
slightly from $246 million in 2009.
• Nonperforming loans decreased $.6 billion, to
$.9 billion, at December 31, 2010 compared with
December 31, 2009. The consumer lending portfolio
comprised 52% of the nonperforming loans at
December 31, 2010. Similar to other banks, PNC
elected to delay foreclosures on residential
mortgages. Nonperforming consumer loans
decreased $.3 billion.
• Net charge-offs were $677 million for 2010 and
$544 million for 2009. The increase was driven by
$75 million of net charge-offs related to the
residential mortgage loan sales in the third quarter
and deterioration in the residential construction
portfolio.
Certain loans in this business segment may require special
servicing given current loan performance and market
conditions. Consequently, the business activities of this
segment are focused on maximizing the value of the portfolio
assigned to it while mitigating risk. Business intent drives the
inclusion of assets in this business segment. Not all impaired
58