PNC Bank 2010 Annual Report Download - page 126
Download and view the complete annual report
Please find page 126 of the 2010 PNC Bank annual report below. You can navigate through the pages in the report by either clicking on the pages listed below, or by using the keyword search tool below to find specific information within the annual report.-
 1
1 -
2
-
3
-
4
-
5
-
6
-
7
-
8
-
9
-
10
-
11
-
12
-
13
-
14
-
15
-
16
-
17
-
18
-
19
-
20
-
21
-
22
-
23
-
24
-
25
-
26
-
27
-
28
-
29
-
30
-
31
-
32
-
33
-
34
-
35
-
36
-
37
-
38
-
39
-
40
-
41
-
42
-
43
-
44
-
45
-
46
-
47
-
48
-
49
-
50
-
51
-
52
-
53
-
54
-
55
-
56
-
57
-
58
-
59
-
60
-
61
-
62
-
63
-
64
-
65
-
66
-
67
-
68
-
69
-
70
-
71
-
72
-
73
-
74
-
75
-
76
-
77
-
78
-
79
-
80
-
81
-
82
-
83
-
84
-
85
-
86
-
87
-
88
-
89
-
90
-
91
-
92
-
93
-
94
-
95
-
96
-
97
-
98
-
99
-
100
-
101
-
102
-
103
-
104
-
105
-
106
-
107
-
108
-
109
-
110
-
111
-
112
-
113
-
114
-
115
-
 116
116 -
 117
117 -
 118
118 -
 119
119 -
 120
120 -
 121
121 -
 122
122 -
 123
123 -
 124
124 -
 125
125 -
 126
126 -
 127
127 -
 128
128 -
 129
129 -
 130
130 -
 131
131 -
 132
132 -
 133
133 -
 134
134 -
 135
135 -
 136
136 -
137
-
138
-
139
-
140
-
141
-
142
-
143
-
144
-
145
-
146
-
147
-
148
-
149
-
150
-
151
-
152
-
153
-
154
-
155
-
156
-
157
-
158
-
159
-
160
-
161
-
162
-
163
-
164
-
165
-
166
-
167
-
168
-
169
-
170
-
171
-
172
-
173
-
174
-
175
-
176
-
177
-
178
-
179
-
180
-
181
-
182
-
183
-
184
-
185
-
186
-
187
-
188
-
189
-
190
-
191
-
192
-
193
-
194
-
195
-
196
-
197
-
198
-
199
-
200
-
201
-
202
-
203
-
204
-
205
-
206
-
207
-
208
-
209
-
210
-
211
-
212
-
213
-
214
 |
 |

counterparties whose aggregate exposure is material in relation
to our total credit exposure. At December 31, 2010, no specific
industry concentration exceeded 6% of total commercial
lending loans outstanding.
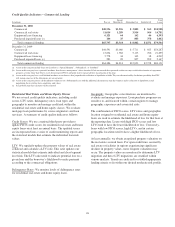
We originate interest-only loans to commercial borrowers.
This is usually to match our borrowers’ asset conversion to
cash expectations (i.e., working capital lines, revolvers). These
products are standard in the financial services industry and are
considered during the underwriting process to mitigate the
increased risk that may result in borrowers not being able to
make interest and principal payments when due. We do not
believe that these product features create a concentration of
credit risk.
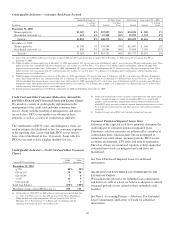
In the normal course of business, we originate or purchase loan
products with contractual features, when concentrated, that
may increase our exposure as a holder of those loan products.
Possible product features that may create a concentration of
credit risk would include a high LTV ratio, terms that may
expose the borrower to future increases in repayments above
increases in market interest rates, below-market interest rates
and interest-only loans, among others. We also originate home
equity loans and lines of credit that are concentrated in our
primary geographic markets.
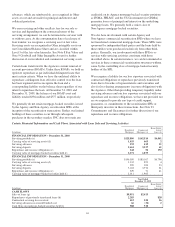
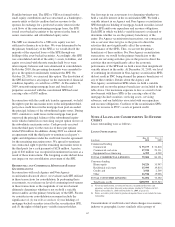
At December 31, 2010, we pledged $12.6 billion of loans to
the Federal Reserve Bank and $32.4 billion of loans to the
Federal Home Loan Bank as collateral for the contingent
ability to borrow, if necessary. The comparable amounts at
December 31, 2009 were $18.8 billion and $32.6 billion,
respectively.
Certain loans are accounted for at fair value with changes in
the fair value reported in current period earnings. The fair
value of these loans was $116 million, or less than 1% of the
total loan portfolio, at December 31, 2010 compared with
$107 million, or less than 1% of the total loan portfolio, at
December 31, 2009.
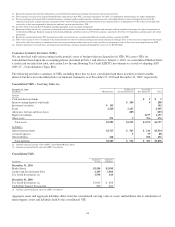
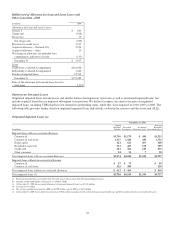
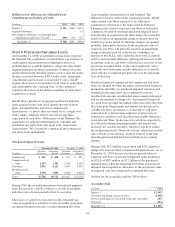
Net Unfunded Credit Commitments
In millions
December 31
2010
December 31
2009
Commercial and commercial real estate $59,256 $ 60,143
Home equity lines of credit 19,172 20,367
Consumer credit card lines 14,725 17,558
Other 2,652 2,727
Total $95,805 $100,795
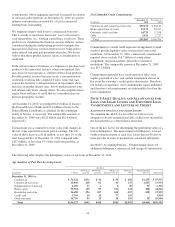
Commitments to extend credit represent arrangements to lend
funds or provide liquidity subject to specified contractual
conditions. At December 31, 2010, commercial commitments
reported above exclude $16.7 billion of syndications,
assignments and participations, primarily to financial
institutions. The comparable amount at December 31, 2009
was $13.2 billion.
Commitments generally have fixed expiration dates, may
require payment of a fee, and contain termination clauses in
the event the customer’s credit quality deteriorates. Based on
our historical experience, most commitments expire unfunded,
and therefore cash requirements are substantially less than the
total commitment.
N
OTE
5A
SSET
Q
UALITY AND
A
LLOWANCES FOR
L
OAN AND
L
EASE
L
OSSES AND
U
NFUNDED
L
OAN
C
OMMITMENTS AND
L
ETTERS OF
C
REDIT
A
LLOWANCE FOR
L
OAN AND
L
EASE
L
OSSES
We maintain the ALLL at a level that we believe to be
adequate to absorb estimated probable credit losses incurred in
the loan portfolio as of the balance sheet date.
One of the key factors for determining the performing status of a
loan is delinquency. The measurement of delinquency is based
on the contractual terms of each loan. Loans that are 30 days or
more past due in terms of payment are considered delinquent.
See Note 1 Accounting Policies – Nonperforming Assets for
additional delinquency, nonaccrual, and charge-off information.
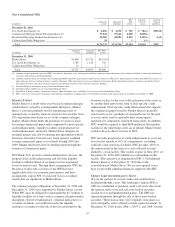
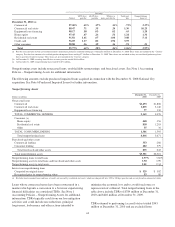
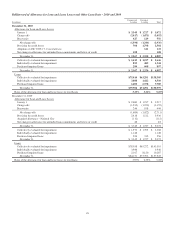
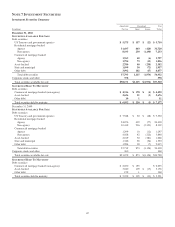
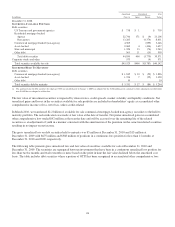
The following table displays the delinquency status of our loans at December 31, 2010.
Age Analysis of Past Due Accruing Loans
Accruing
In millions Current
30-59 days
past due
60-89 days
past due
90 days or
more past due (b)
Total past
due
Nonperforming
loans (c) Total loans
December 31, 2010 (a)
Commercial $ 53,522 $251 $ 92 $ 59 $ 402 $1,253 $ 55,177
Commercial real estate 15,866 128 62 43 233 1,835 17,934
Equipment lease financing 6,276 37 2 1 40 77 6,393
Home equity 33,354 159 91 174 424 448 34,226
Residential real estate 14,688 226 107 160 493 818 15,999
Credit card 3,765 46 32 77 155 3,920
Other consumer 16,756 95 32 28 155 35 16,946
Total $144,227 $942 $418 $542 $1,902 $4,466 $150,595
118