PNC Bank 2010 Annual Report Download - page 2
Download and view the complete annual report
Please find page 2 of the 2010 PNC Bank annual report below. You can navigate through the pages in the report by either clicking on the pages listed below, or by using the keyword search tool below to find specific information within the annual report.-
 1
1 -
 2
2 -
 3
3 -
 4
4 -
 5
5 -
 6
6 -
 7
7 -
 8
8 -
 9
9 -
 10
10 -
 11
11 -
 12
12 -
 13
13 -
14
-
15
-
16
-
17
-
18
-
19
-
20
-
21
-
22
-
23
-
24
-
25
-
26
-
27
-
28
-
29
-
30
-
31
-
32
-
33
-
34
-
35
-
36
-
37
-
38
-
39
-
40
-
41
-
42
-
43
-
44
-
45
-
46
-
47
-
48
-
49
-
50
-
51
-
52
-
53
-
54
-
55
-
56
-
57
-
58
-
59
-
60
-
61
-
62
-
63
-
64
-
65
-
66
-
67
-
68
-
69
-
70
-
71
-
72
-
73
-
74
-
75
-
76
-
77
-
78
-
79
-
80
-
81
-
82
-
83
-
84
-
85
-
86
-
87
-
88
-
89
-
90
-
91
-
92
-
93
-
94
-
95
-
96
-
97
-
98
-
99
-
100
-
101
-
102
-
103
-
104
-
105
-
106
-
107
-
108
-
109
-
110
-
111
-
112
-
113
-
114
-
115
-
116
-
117
-
118
-
119
-
120
-
121
-
122
-
123
-
124
-
125
-
126
-
127
-
128
-
129
-
130
-
131
-
132
-
133
-
134
-
135
-
136
-
137
-
138
-
139
-
140
-
141
-
142
-
143
-
144
-
145
-
146
-
147
-
148
-
149
-
150
-
151
-
152
-
153
-
154
-
155
-
156
-
157
-
158
-
159
-
160
-
161
-
162
-
163
-
164
-
165
-
166
-
167
-
168
-
169
-
170
-
171
-
172
-
173
-
174
-
175
-
176
-
177
-
178
-
179
-
180
-
181
-
182
-
183
-
184
-
185
-
186
-
187
-
188
-
189
-
190
-
191
-
192
-
193
-
194
-
195
-
196
-
197
-
198
-
199
-
200
-
201
-
202
-
203
-
204
-
205
-
206
-
207
-
208
-
209
-
210
-
211
-
212
-
213
-
214
 |
 |

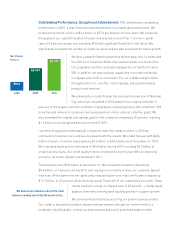
Net Income
Millions
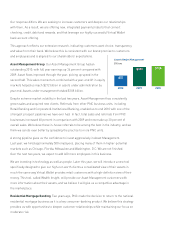
Outstanding Performance, Exceptional Achievements PNC delivered an outstanding
performance in 2010, a year of exceptional achievements in a challenging environment. We
produced record net income of $3.4 billion or $5.74 per diluted common share. We enhanced
the quality of our capital throughout the year and reached a record Tier 1 common capital
ratio of 9.8 percent at year end, providing PNC with significant flexibility for the future. We
significantly increased the number of clients we serve and are well positioned for future growth.
We have a powerful banking franchise stretching across 14 states and
the District of Columbia. Within that market resides one-third of the
U.S. population and the corporate headquarters of half the Fortune
500. In addition, we have national capabilities to provide residential
mortgages and credit to consumers. For our middle-market clients
throughout the U.S., we offer credit, liquidity, and capital markets
products and services.
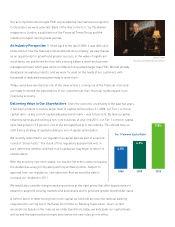
We enhanced our scale through the successful conversion of National
City, which we completed in 2010 ahead of our original schedule. It
was one of the largest customer and branch integrations in banking history. We converted 1,300
branches and millions of customers and surpassed our initial customer retention goals. We
also exceeded the original cost savings goal for the combined company by 50 percent, reaching
$1.8 billion on an annualized basis by the end of 2010.
I am fond of saying that eventually all companies meet their balance sheet. In 2010 we
continued to transition ours, and we are pleased with the results. We ended the year with $264
billion of assets. Common equity grew by $7.6 billion to $29.6 billion as of December 31, 2010.
We originated loans and commitments of $149 billion during 2010, including $3.5 billion of
small business loans. Our credit quality metrics improved during the year. With an improving
economy, we expect greater loan demand in 2011.
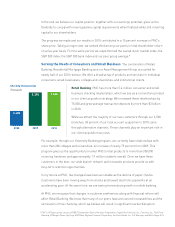
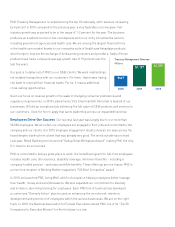
Total deposits were $183 billion at December 31. We increased transaction deposits by
$8.4 billion, or 7 percent, during 2010, a strong sign of our ability to grow our customer deposit
franchise. At the same time we significantly reduced higher-cost retail certificates of deposit by
$11.3 billion, or 23 percent, while retaining nearly 75 percent of our relationship accounts. These
trends resulted in a loan-to-deposit ratio of 82 percent – a highly liquid
balance sheet with a strong bank liquidity position to support growth.
We achieved these results by executing our proven business model.
Our model is designed to produce diverse revenue streams through our commitment to a
moderate risk philosophy, continuous improvement and a well-positioned balance sheet.
We believe we stand as one of the clear
winners coming out of the financial crisis…
$918
$2,403
2008 2009 2010
$3,397