PNC Bank 2010 Annual Report Download - page 36
Download and view the complete annual report
Please find page 36 of the 2010 PNC Bank annual report below. You can navigate through the pages in the report by either clicking on the pages listed below, or by using the keyword search tool below to find specific information within the annual report.-
 1
1 -
2
-
3
-
4
-
5
-
6
-
7
-
8
-
9
-
10
-
11
-
12
-
13
-
14
-
15
-
16
-
17
-
18
-
19
-
20
-
21
-
22
-
23
-
24
-
25
-
 26
26 -
 27
27 -
 28
28 -
 29
29 -
 30
30 -
 31
31 -
 32
32 -
 33
33 -
 34
34 -
 35
35 -
 36
36 -
 37
37 -
 38
38 -
 39
39 -
 40
40 -
 41
41 -
 42
42 -
 43
43 -
 44
44 -
 45
45 -
 46
46 -
47
-
48
-
49
-
50
-
51
-
52
-
53
-
54
-
55
-
56
-
57
-
58
-
59
-
60
-
61
-
62
-
63
-
64
-
65
-
66
-
67
-
68
-
69
-
70
-
71
-
72
-
73
-
74
-
75
-
76
-
77
-
78
-
79
-
80
-
81
-
82
-
83
-
84
-
85
-
86
-
87
-
88
-
89
-
90
-
91
-
92
-
93
-
94
-
95
-
96
-
97
-
98
-
99
-
100
-
101
-
102
-
103
-
104
-
105
-
106
-
107
-
108
-
109
-
110
-
111
-
112
-
113
-
114
-
115
-
116
-
117
-
118
-
119
-
120
-
121
-
122
-
123
-
124
-
125
-
126
-
127
-
128
-
129
-
130
-
131
-
132
-
133
-
134
-
135
-
136
-
137
-
138
-
139
-
140
-
141
-
142
-
143
-
144
-
145
-
146
-
147
-
148
-
149
-
150
-
151
-
152
-
153
-
154
-
155
-
156
-
157
-
158
-
159
-
160
-
161
-
162
-
163
-
164
-
165
-
166
-
167
-
168
-
169
-
170
-
171
-
172
-
173
-
174
-
175
-
176
-
177
-
178
-
179
-
180
-
181
-
182
-
183
-
184
-
185
-
186
-
187
-
188
-
189
-
190
-
191
-
192
-
193
-
194
-
195
-
196
-
197
-
198
-
199
-
200
-
201
-
202
-
203
-
204
-
205
-
206
-
207
-
208
-
209
-
210
-
211
-
212
-
213
-
214
 |
 |

• Customer demand for other products and services,
• Changes in the competitive and regulatory landscape
and in counterparty creditworthiness and
performance as the financial services industry
restructures in the current environment,
• The impact of the extensive reforms enacted in the
Dodd-Frank legislation and other legislative,
regulatory and administrative initiatives, including
those outlined above, and
• The impact of market credit spreads on asset
valuations.
In addition, our success will depend, among other things,
upon:
• Further success in the acquisition, growth and
retention of customers,
• Continued development of the geographic markets
related to our recent acquisitions, including full
deployment of our product offerings,
• Revenue growth,
• A sustained focus on expense management, and
creating positive pre-tax, pre-provision earnings,
• Managing the distressed assets portfolio and other
impaired assets,
• Improving our overall asset quality and continuing to
meet evolving regulatory capital standards,
• Continuing to maintain and grow our deposit base as
a low-cost funding source,
• Prudent risk and capital management related to our
efforts to return to our desired moderate risk profile,
and
• Actions we take within the capital and other financial
markets.
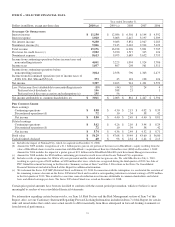
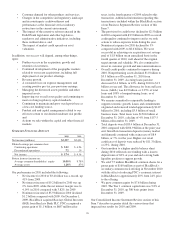
S
UMMARY
F
INANCIAL
R
ESULTS
2010 2009
Net income (millions) $3,397 $2,403
Diluted earnings per common share
Continuing operations $ 5.02 $ 4.26
Discontinued operations .72 .10
Net income $ 5.74 $ 4.36
Return from net income on:
Average common shareholders’ equity 10.88% 9.78%
Average assets 1.28% .87%
Our performance in 2010 included the following:
• Net income for 2010 of $3.4 billion was a record, up
41% from 2009.
• Net interest income of $9.2 billion for 2010 was up
2% from 2009, while the net interest margin rose to
4.14% in 2010 compared with 3.82% for 2009.
• Noninterest income of $5.9 billion in 2010 declined
$1.2 billion compared with 2009. On December 1,
2009, BlackRock acquired Barclays Global Investors
(BGI) from Barclays Bank PLC. PNC recognized a
pretax gain of $1.1 billion, or $687 million after
taxes, in the fourth quarter of 2009 related to this
transaction. Additional information regarding this
transaction is included within the BlackRock section
of our Business Segments Review section of this
Item 7.
• The provision for credit losses declined to $2.5 billion
in 2010 compared with $3.9 billion in 2009 as overall
credit quality continued to improve and as we took
actions to reduce exposure levels during the year.
• Noninterest expense for 2010 declined by 5%
compared with 2009, to $8.6 billion. We were
successful in achieving our acquisition cost savings
goal of $1.8 billion on an annualized basis in the
fourth quarter of 2010, well ahead of the original
target amount and schedule. We also continued to
invest in customer growth and innovation initiatives.
• Overall credit quality continued to improve during
2010. Nonperforming assets declined $1.0 billion to
$5.3 billion as of December 31, 2010 from
December 31, 2009. Accruing loans past due
decreased $1.4 billion, or 42%, during 2010 to $1.9
billion at year end. The allowance for loan and lease
losses (ALLL) was $4.9 billion, or 3.25% of total
loans and 109% of nonperforming loans, as of
December 31, 2010.
• We remain committed to responsible lending to
support economic growth. Loans and commitments
originated and renewed totaled approximately $149
billion for 2010, including $3.5 billion of small
business loans. Total loans were $150.6 billion at
December 31, 2010, a decline of 4% from $157.5
billion at December 31, 2009.
• Total deposits were $183.4 billion at December 31,
2010 compared with $186.9 billion at the prior year
end. Growth in transaction deposits (money market
and demand) continued with an increase of $8.4
billion, or 7%, for the year. Higher cost retail
certificates of deposit were reduced by $11.3 billion,
or 23%, during 2010.
• Our transition to a higher quality balance sheet
during 2010 reflected core funding with a loan to
deposit ratio of 82% at year end and a strong bank
liquidity position to support growth.
• We sold 7.5 million BlackRock common shares for a
pretax gain of $160 million as part of BlackRock’s
secondary common stock offering in November 2010
with the effect of reducing PNC’s economic interest
in BlackRock to approximately 20% from 24% prior
to the offering.
• We grew common equity by $7.6 billion during
2010. The Tier 1 common capital ratio was 9.8% at
December 31, 2010, up 380 basis points from
December 31, 2009.
Our Consolidated Income Statement Review section of this
Item 7 describes in greater detail the various items that
impacted our results for 2010 and 2009.
28