PNC Bank 2010 Annual Report Download - page 127
Download and view the complete annual report
Please find page 127 of the 2010 PNC Bank annual report below. You can navigate through the pages in the report by either clicking on the pages listed below, or by using the keyword search tool below to find specific information within the annual report.-
 1
1 -
2
-
3
-
4
-
5
-
6
-
7
-
8
-
9
-
10
-
11
-
12
-
13
-
14
-
15
-
16
-
17
-
18
-
19
-
20
-
21
-
22
-
23
-
24
-
25
-
26
-
27
-
28
-
29
-
30
-
31
-
32
-
33
-
34
-
35
-
36
-
37
-
38
-
39
-
40
-
41
-
42
-
43
-
44
-
45
-
46
-
47
-
48
-
49
-
50
-
51
-
52
-
53
-
54
-
55
-
56
-
57
-
58
-
59
-
60
-
61
-
62
-
63
-
64
-
65
-
66
-
67
-
68
-
69
-
70
-
71
-
72
-
73
-
74
-
75
-
76
-
77
-
78
-
79
-
80
-
81
-
82
-
83
-
84
-
85
-
86
-
87
-
88
-
89
-
90
-
91
-
92
-
93
-
94
-
95
-
96
-
97
-
98
-
99
-
100
-
101
-
102
-
103
-
104
-
105
-
106
-
107
-
108
-
109
-
110
-
111
-
112
-
113
-
114
-
115
-
116
-
 117
117 -
 118
118 -
 119
119 -
 120
120 -
 121
121 -
 122
122 -
 123
123 -
 124
124 -
 125
125 -
 126
126 -
 127
127 -
 128
128 -
 129
129 -
 130
130 -
 131
131 -
 132
132 -
 133
133 -
 134
134 -
 135
135 -
 136
136 -
 137
137 -
138
-
139
-
140
-
141
-
142
-
143
-
144
-
145
-
146
-
147
-
148
-
149
-
150
-
151
-
152
-
153
-
154
-
155
-
156
-
157
-
158
-
159
-
160
-
161
-
162
-
163
-
164
-
165
-
166
-
167
-
168
-
169
-
170
-
171
-
172
-
173
-
174
-
175
-
176
-
177
-
178
-
179
-
180
-
181
-
182
-
183
-
184
-
185
-
186
-
187
-
188
-
189
-
190
-
191
-
192
-
193
-
194
-
195
-
196
-
197
-
198
-
199
-
200
-
201
-
202
-
203
-
204
-
205
-
206
-
207
-
208
-
209
-
210
-
211
-
212
-
213
-
214
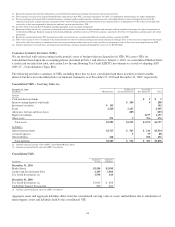
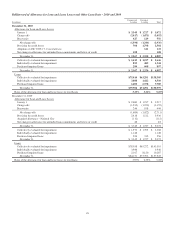
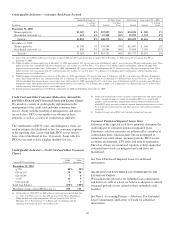
 |
 |

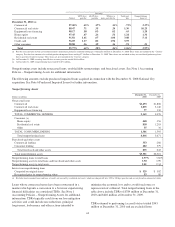
Accruing
Current
30-59 days
past due
60-89 days
past due
90 days or
more past due (b)
Total past
due
Nonperforming
loans (c)
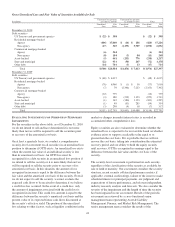
December 31, 2010 (a)
Commercial 97.00% .45% .17% .11% .73% 2.27%
Commercial real estate 88.47 .71 .35 .24 1.30 10.23
Equipment lease financing 98.17 .58 .03 .02 .63 1.20
Home equity 97.45 .47 .26 .51 1.24 1.31
Residential real estate 91.81 1.41 .67 1.00 3.08 5.11
Credit card 96.05 1.17 .82 1.96 3.95
Other consumer 98.88 .56 .19 .16 .91 .21
Total 95.77% .62% .28% .36% 1.26% 2.97%
(a) Past due loan amounts exclude government insured / guaranteed, primarily residential mortgages, totaling $2.6 billion at December 31, 2010. These loans are included in the ‘Current’
category. Past due loan amounts also exclude purchased impaired loans totaling $7.8 billion at December 31, 2010. These loans are excluded as they are considered performing loans
due to accretion of interest income. These loans are also included in the ‘Current’ category.
(b) At December 31, 2009, accruing loans 90 days or more past due totaled $884 million.
(c) At December 31, 2009, nonperforming loans totaled $5,671 million.
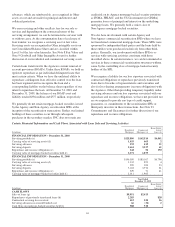
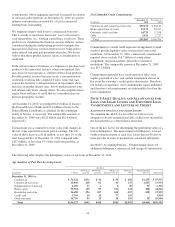
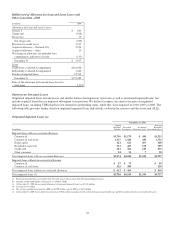
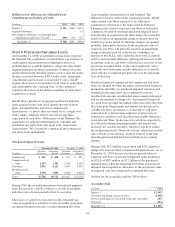
Nonperforming assets include nonaccrual loans, troubled debt restructurings, and foreclosed assets. See Note 1 Accounting
Policies – Nonperforming Assets for additional information.
The following amounts exclude purchased impaired loans acquired in connection with the December 31, 2008 National City
acquisition. See Note 6 Purchased Impaired Loans for further information.
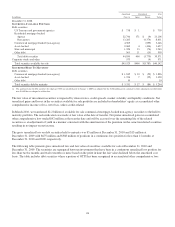
Nonperforming Assets
Dollars in millions
December 31,
2010
December 31,
2009
Nonaccrual loans
Commercial $1,253 $1,806
Commercial real estate 1,835 2,140
Equipment lease financing 77 130
TOTAL COMMERCIAL LENDING 3,165 4,076
Consumer (a)
Home equity 448 356
Residential real estate 818 1,203
Other 35 36
TOTAL CONSUMER LENDING 1,301 1,595
Total nonperforming loans 4,466 5,671
Foreclosed and other assets
Commercial lending 353 266
Consumer lending 482 379
Total foreclosed and other assets 835 645
Total nonperforming assets $5,301 $6,316
Nonperforming loans to total loans 2.97% 3.60%
Nonperforming assets to total loans and foreclosed and other assets 3.50 3.99
Nonperforming assets to total assets 2.01 2.34
Interest on nonperforming loans
Computed on original terms $ 329 $ 302
Recognized prior to nonperforming status 53 90
(a) Excludes most consumer loans and lines of credit, not secured by residential real estate, which are charged off after 120 to 180 days past due and are not placed on nonaccrual status.
Loans whose contractual terms have been restructured in a
manner which grants a concession to a borrower experiencing
financial difficulties are considered TDRs. See Note 1
Accounting Policies – Nonperforming Assets for additional
information. TDRs typically result from our loss mitigation
activities and could include rate reductions, principal
forgiveness, forbearance and other actions intended to
minimize the economic loss and to avoid foreclosure or
repossession of collateral. Total nonperforming loans in the
table above include TDRs of $784 million at December 31,
2010 and $440 million at December 31, 2009.
TDRs returned to performing (accrual) status totaled $543
million at December 31, 2010 and are excluded from
119