PNC Bank 2010 Annual Report Download - page 194
Download and view the complete annual report
Please find page 194 of the 2010 PNC Bank annual report below. You can navigate through the pages in the report by either clicking on the pages listed below, or by using the keyword search tool below to find specific information within the annual report.-
 1
1 -
2
-
3
-
4
-
5
-
6
-
7
-
8
-
9
-
10
-
11
-
12
-
13
-
14
-
15
-
16
-
17
-
18
-
19
-
20
-
21
-
22
-
23
-
24
-
25
-
26
-
27
-
28
-
29
-
30
-
31
-
32
-
33
-
34
-
35
-
36
-
37
-
38
-
39
-
40
-
41
-
42
-
43
-
44
-
45
-
46
-
47
-
48
-
49
-
50
-
51
-
52
-
53
-
54
-
55
-
56
-
57
-
58
-
59
-
60
-
61
-
62
-
63
-
64
-
65
-
66
-
67
-
68
-
69
-
70
-
71
-
72
-
73
-
74
-
75
-
76
-
77
-
78
-
79
-
80
-
81
-
82
-
83
-
84
-
85
-
86
-
87
-
88
-
89
-
90
-
91
-
92
-
93
-
94
-
95
-
96
-
97
-
98
-
99
-
100
-
101
-
102
-
103
-
104
-
105
-
106
-
107
-
108
-
109
-
110
-
111
-
112
-
113
-
114
-
115
-
116
-
117
-
118
-
119
-
120
-
121
-
122
-
123
-
124
-
125
-
126
-
127
-
128
-
129
-
130
-
131
-
132
-
133
-
134
-
135
-
136
-
137
-
138
-
139
-
140
-
141
-
142
-
143
-
144
-
145
-
146
-
147
-
148
-
149
-
150
-
151
-
152
-
153
-
154
-
155
-
156
-
157
-
158
-
159
-
160
-
161
-
162
-
163
-
164
-
165
-
166
-
167
-
168
-
169
-
170
-
171
-
172
-
173
-
174
-
175
-
176
-
177
-
178
-
179
-
180
-
181
-
182
-
183
-
 184
184 -
 185
185 -
 186
186 -
 187
187 -
 188
188 -
 189
189 -
 190
190 -
 191
191 -
 192
192 -
 193
193 -
 194
194 -
 195
195 -
 196
196 -
 197
197 -
 198
198 -
 199
199 -
 200
200 -
 201
201 -
 202
202 -
 203
203 -
 204
204 -
205
-
206
-
207
-
208
-
209
-
210
-
211
-
212
-
213
-
214
 |
 |

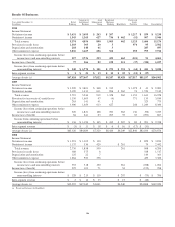
Results Of Businesses
Year ended December 31
In millions
Retail
Banking
Corporate &
Institutional
Banking
Asset
Management
Group
Residential
Mortgage
Banking BlackRock
Distressed
Assets
Portfolio Other Consolidated
2010
Income Statement
Net interest income $ 3,431 $ 3,493 $ 263 $ 267 $ 1,217 $ 559 $ 9,230
Noninterest income 1,943 1,363 627 736 $ 462 (92) 907 5,946
Total revenue 5,374 4,856 890 1,003 462 1,125 1,466 15,176
Provision for credit losses 1,103 303 20 5 976 95 2,502
Depreciation and amortization 218 148 41 3 287 697
Other noninterest expense 3,836 1,669 606 562 250 993 7,916
Income (loss) from continuing operations before
income taxes and noncontrolling interests 217 2,736 223 433 462 (101) 91 4,061
Income taxes (benefit) 77 966 82 158 111 (37) (320) 1,037
Income (loss) from continuing operations before
noncontrolling interests $ 140 $ 1,770 $ 141 $ 275 $ 351 $ (64) $ 411 $ 3,024
Inter-segment revenue $ 1 $ 21 $ 13 $ 12 $ 22 $ (12) $ (57)
Average Assets (a) $67,024 $77,467 $7,022 $9,247 $5,428 $17,517 $81,197 $264,902
2009
Income Statement
Net interest income $ 3,520 $ 3,801 $ 308 $ 332 $ 1,079 $ 43 $ 9,083
Noninterest income 2,199 1,433 611 996 $ 262 74 1,570 7,145
Total revenue 5,719 5,234 919 1,328 262 1,153 1,613 16,228
Provision for (recoveries of) credit losses 1,330 1,603 97 (4) 771 133 3,930
Depreciation and amortization 263 141 41 5 323 773
Other noninterest expense 3,906 1,659 613 627 246 1,249 8,300
Income (loss) from continuing operations before
income taxes and noncontrolling interests 220 1,831 168 700 262 136 (92) 3,225
Income taxes (benefit) 84 641 63 265 55 52 (293) 867
Income from continuing operations before
noncontrolling interests $ 136 $ 1,190 $ 105 $ 435 $ 207 $ 84 $ 201 $ 2,358
Inter-segment revenue $ (3) $ 11 $ 18 $ 6 $ 16 $ (17) $ (31)
Average Assets (a) $65,320 $84,689 $7,320 $8,420 $6,249 $22,844 $82,034 $276,876
2008
Income Statement
Net interest income $ 1,593 $ 1,302 $ 130 $ 829 $ 3,854
Noninterest income 1,137 536 429 $ 261 79 2,442
Total revenue 2,730 1,838 559 261 908 6,296
Provision for credit losses 388 575 6 548 1,517
Depreciation and amortization 125 22 7 149 303
Other noninterest expense 1,664 923 356 439 3,382
Income (loss) from continuing operations before
income taxes and noncontrolling interests 553 318 190 261 (228) 1,094
Income taxes (benefit) 225 103 71 54 (155) 298
Income (loss) from continuing operations before
noncontrolling interests $ 328 $ 215 $ 119 $ 207 $ (73) $ 796
Inter-segment revenue $ 2 $ 14 $ 15 $ 15 $ (46)
Average Assets (a) $32,922 $47,049 $3,001 $4,240 $54,808 $142,020
(a) Period-end balances for BlackRock.
186