PNC Bank 2010 Annual Report Download - page 37
Download and view the complete annual report
Please find page 37 of the 2010 PNC Bank annual report below. You can navigate through the pages in the report by either clicking on the pages listed below, or by using the keyword search tool below to find specific information within the annual report.-
 1
1 -
2
-
3
-
4
-
5
-
6
-
7
-
8
-
9
-
10
-
11
-
12
-
13
-
14
-
15
-
16
-
17
-
18
-
19
-
20
-
21
-
22
-
23
-
24
-
25
-
26
-
 27
27 -
 28
28 -
 29
29 -
 30
30 -
 31
31 -
 32
32 -
 33
33 -
 34
34 -
 35
35 -
 36
36 -
 37
37 -
 38
38 -
 39
39 -
 40
40 -
 41
41 -
 42
42 -
 43
43 -
 44
44 -
 45
45 -
 46
46 -
 47
47 -
48
-
49
-
50
-
51
-
52
-
53
-
54
-
55
-
56
-
57
-
58
-
59
-
60
-
61
-
62
-
63
-
64
-
65
-
66
-
67
-
68
-
69
-
70
-
71
-
72
-
73
-
74
-
75
-
76
-
77
-
78
-
79
-
80
-
81
-
82
-
83
-
84
-
85
-
86
-
87
-
88
-
89
-
90
-
91
-
92
-
93
-
94
-
95
-
96
-
97
-
98
-
99
-
100
-
101
-
102
-
103
-
104
-
105
-
106
-
107
-
108
-
109
-
110
-
111
-
112
-
113
-
114
-
115
-
116
-
117
-
118
-
119
-
120
-
121
-
122
-
123
-
124
-
125
-
126
-
127
-
128
-
129
-
130
-
131
-
132
-
133
-
134
-
135
-
136
-
137
-
138
-
139
-
140
-
141
-
142
-
143
-
144
-
145
-
146
-
147
-
148
-
149
-
150
-
151
-
152
-
153
-
154
-
155
-
156
-
157
-
158
-
159
-
160
-
161
-
162
-
163
-
164
-
165
-
166
-
167
-
168
-
169
-
170
-
171
-
172
-
173
-
174
-
175
-
176
-
177
-
178
-
179
-
180
-
181
-
182
-
183
-
184
-
185
-
186
-
187
-
188
-
189
-
190
-
191
-
192
-
193
-
194
-
195
-
196
-
197
-
198
-
199
-
200
-
201
-
202
-
203
-
204
-
205
-
206
-
207
-
208
-
209
-
210
-
211
-
212
-
213
-
214
 |
 |
B
ALANCE
S
HEET
H
IGHLIGHTS
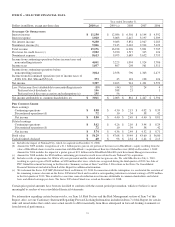
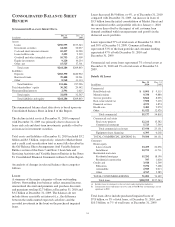
Total assets were $264.3 billion at December 31, 2010
compared with $269.9 billion at December 31, 2009. The
decline from year end 2009 resulted from a decline in loans,
other assets and short-term investments and cash somewhat
offset by an increase in investment securities.
Various seasonal and other factors impact our period-end
balances whereas average balances are generally more
indicative of underlying business trends apart from the impact
of acquisitions, divestitures and consolidations of variable
interest entities.
The Consolidated Balance Sheet Review section of this Item 7
provides information on changes in selected Consolidated
Balance Sheet categories at December 31, 2010 compared
with December 31, 2009.
Total average assets were $264.9 billion for 2010 compared
with $276.9 billion for 2009.
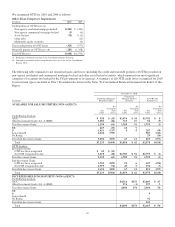
Average interest-earning assets were $224.7 billion for 2010,
compared with $238.5 billion in 2009. Decreases of $11.9
billion in loans and $6.5 billion in other interest-earning
assets, partially offset by a $5.7 billion increase in investment
securities, drove the decrease in this comparison.
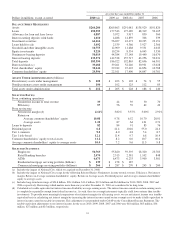
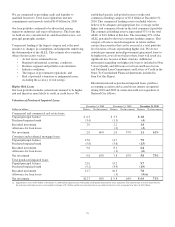
The decrease in average total loans reflected a decline in
commercial loans of $6.8 billion, commercial real estate loans
of $4.3 billion and residential mortgage loans of $3.4 billion,
partially offset by an increase of $2.6 billion in consumer
loans. Loans represented 68% of average interest-earning
assets for 2010 and 69% for 2009.
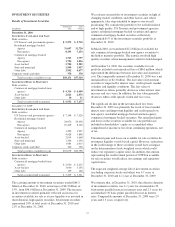
Average securities available for sale increased $2.7 billion, to
$50.8 billion, in 2010 compared with 2009. Average US
Treasury and government agencies securities increased
$3.1 billion while agency residential mortgage-backed
securities increased $1.5 billion and other debt securities
increased $1.5 billion in the comparison. These increases were
partially offset by a decline of $2.8 billion in average
non-agency residential mortgage-backed securities and a
decline of $1.1 billion in commercial mortgage-backed
securities.
Average securities held to maturity increased $3.0 billion, to
$7.2 billion, in 2010 compared with 2009. The increase
reflected purchases of asset-backed and non-agency
commercial mortgage-backed securities, the transfer of
non-agency commercial mortgage-backed securities from the
available for sale portfolio, and the impact of the Market
Street Funding LLC (Market Street) consolidation effective
January 1, 2010.
Total investment securities comprised 26% of average
interest-earning assets for 2010 and 22% for 2009.
Average noninterest-earning assets totaled $40.2 billion in
2010 compared with $38.4 billion in the prior year period.
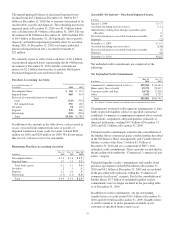
Average total deposits were $181.9 billion for 2010 compared
with $189.9 billion for 2009. Average deposits declined from
the prior year period primarily as a result of decreases in retail
certificates of deposit and other time deposits, which were
partially offset by an increase in transaction deposits. Average
transaction deposits were $128.4 billion for 2010 compared
with $120.2 billion for 2009 reflecting our strategy to grow
demand and money market deposits. Total deposits at
December 31, 2010 were $183.4 billion compared with $186.9
billion at December 31, 2009 and are further discussed within
the Consolidated Balance Sheet Review section of this Report.
Average total deposits represented 69% of average total assets
for both 2010 and 2009.
Average borrowed funds were $40.2 billion for 2010
compared with $44.1 billion for 2009. A $6.2 billion decline
in Federal Home Loan Bank borrowings drove the decline in
the comparison, partially offset by higher average commercial
paper borrowings that reflected the consolidation of Market
Street.
Total borrowed funds at December 31, 2010 were $39.5
billion compared with $39.3 billion at December 31, 2009 and
are further discussed within the Consolidated Balance Sheet
Review section of this Item 7. In addition, the Liquidity Risk
Management portion of the Risk Management section of this
Item 7 includes additional information regarding our sources
and uses of borrowed funds.
29