PNC Bank 2010 Annual Report Download - page 49
Download and view the complete annual report
Please find page 49 of the 2010 PNC Bank annual report below. You can navigate through the pages in the report by either clicking on the pages listed below, or by using the keyword search tool below to find specific information within the annual report.-
 1
1 -
2
-
3
-
4
-
5
-
6
-
7
-
8
-
9
-
10
-
11
-
12
-
13
-
14
-
15
-
16
-
17
-
18
-
19
-
20
-
21
-
22
-
23
-
24
-
25
-
26
-
27
-
28
-
29
-
30
-
31
-
32
-
33
-
34
-
35
-
36
-
37
-
38
-
 39
39 -
 40
40 -
 41
41 -
 42
42 -
 43
43 -
 44
44 -
 45
45 -
 46
46 -
 47
47 -
 48
48 -
 49
49 -
 50
50 -
 51
51 -
 52
52 -
 53
53 -
 54
54 -
 55
55 -
 56
56 -
 57
57 -
 58
58 -
 59
59 -
60
-
61
-
62
-
63
-
64
-
65
-
66
-
67
-
68
-
69
-
70
-
71
-
72
-
73
-
74
-
75
-
76
-
77
-
78
-
79
-
80
-
81
-
82
-
83
-
84
-
85
-
86
-
87
-
88
-
89
-
90
-
91
-
92
-
93
-
94
-
95
-
96
-
97
-
98
-
99
-
100
-
101
-
102
-
103
-
104
-
105
-
106
-
107
-
108
-
109
-
110
-
111
-
112
-
113
-
114
-
115
-
116
-
117
-
118
-
119
-
120
-
121
-
122
-
123
-
124
-
125
-
126
-
127
-
128
-
129
-
130
-
131
-
132
-
133
-
134
-
135
-
136
-
137
-
138
-
139
-
140
-
141
-
142
-
143
-
144
-
145
-
146
-
147
-
148
-
149
-
150
-
151
-
152
-
153
-
154
-
155
-
156
-
157
-
158
-
159
-
160
-
161
-
162
-
163
-
164
-
165
-
166
-
167
-
168
-
169
-
170
-
171
-
172
-
173
-
174
-
175
-
176
-
177
-
178
-
179
-
180
-
181
-
182
-
183
-
184
-
185
-
186
-
187
-
188
-
189
-
190
-
191
-
192
-
193
-
194
-
195
-
196
-
197
-
198
-
199
-
200
-
201
-
202
-
203
-
204
-
205
-
206
-
207
-
208
-
209
-
210
-
211
-
212
-
213
-
214
 |
 |

L
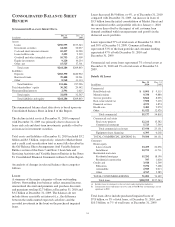
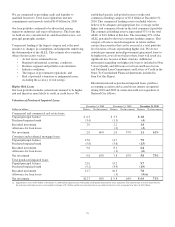
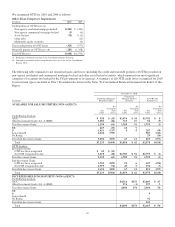
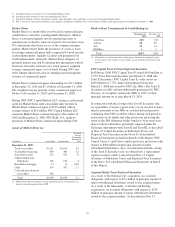
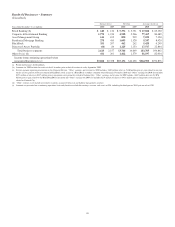
OANS
H
ELD
F
OR
S
ALE
In millions
Dec. 31
2010
Dec. 31
2009
Commercial mortgages at fair value $ 877 $1,050
Commercial mortgages at lower of cost or
market 330 251
Total commercial mortgages 1,207 1,301
Residential mortgages at fair value 1,878 1,012
Residential mortgages at lower of cost or market 12
Total residential mortgages 1,890 1,012
Other 395 226
Total $3,492 $2,539
We stopped originating certain commercial mortgage loans
designated as held for sale during the first quarter of 2008 and
continue pursuing opportunities to reduce these positions at
appropriate prices. We sold $241 million of commercial
mortgage loans held for sale carried at fair value in 2010 and
sold $272 million in 2009.
We recognized net losses of $18 million in 2010 on the
valuation and sale of commercial mortgage loans held for sale,
net of hedges. Net gains of $107 million on the valuation and
sale of commercial mortgages loans held for sale, net of
hedges, were recognized in 2009.
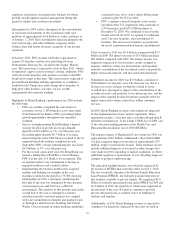
Residential mortgage loan origination volume was $10.5
billion in 2010. Substantially all such loans were originated
under agency or Federal Housing Administration (FHA)
standards. We sold $10.0 billion of loans and recognized
related gains of $231 million during 2010. The comparable
amounts for 2009 were $19.8 billion and $435 million,
respectively.
The increase in the Other category resulted from the transfer
of certain commercial loans and leases to held for sale in the
fourth quarter of 2010.
Interest income on loans held for sale was $263 million in
2010 and $270 million in 2009 and is included in Other
interest income on our Consolidated Income Statement.
G
OODWILL AND
O
THER
I
NTANGIBLE
A
SSETS
Goodwill and other intangible assets totaled $10.8 billion at
December 31, 2010 compared with $12.9 billion at December,
31, 2009. Goodwill declined $1.4 billion, to $8.1 billion, at
December 31, 2010 compared with the December 31, 2009
balance primarily due to the sale of GIS which reduced
goodwill by $1.2 billion. The $.8 billion decline in other
intangible assets from December 31, 2009 included $.3 billion
declines in both commercial and residential mortgage
servicing rights. Note 9 Goodwill and Other Intangible Assets
included in the Notes To Consolidated Financial Statements in
Item 8 of this Report provides further information on these
items.
F
UNDING AND
C
APITAL
S
OURCES
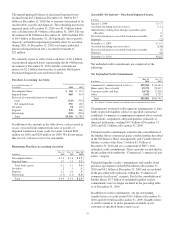
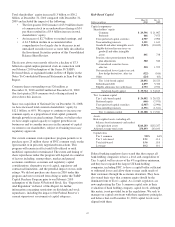
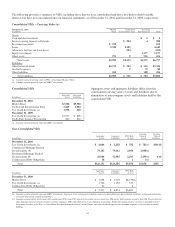
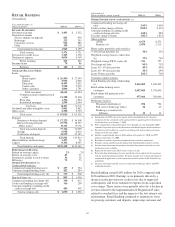
Details Of Funding Sources
In millions
Dec. 31
2010
Dec. 31
2009
Deposits
Money market $ 84,581 $ 85,838
Demand 50,069 40,406
Retail certificates of deposit 37,337 48,622
Savings 7,340 6,401
Other time 549 1,088
Time deposits in foreign offices 3,514 4,567
Total deposits 183,390 186,922
Borrowed funds
Federal funds purchased and repurchase
agreements 4,144 3,998
Federal Home Loan Bank borrowings 6,043 10,761
Bank notes and senior debt 12,904 12,362
Subordinated debt 9,842 9,907
Other 6,555 2,233
Total borrowed funds 39,488 39,261
Total $222,878 $226,183
Total funding sources decreased $3.3 billion at December 31,
2010 compared with December 31, 2009.
Total deposits decreased $3.5 billion at December 31, 2010
compared with December 31, 2009. Deposits decreased in the
comparison primarily due to declines in retail certificates of
deposit, time deposits in foreign offices and money market
deposits, partially offset by an increase in demand deposits.
Interest-bearing deposits represented 73% of total deposits at
December 31, 2010 compared with 76% at December 31,
2009.
Total borrowed funds increased $.2 billion since
December 31, 2009. Other borrowed funds increased in the
comparison primarily due to the consolidation of Market
Street and a credit card securitization trust. Additionally, bank
notes and senior debt increased since December 31, 2009 due
to net issuances. These increases were partially offset in the
comparison by a decline of Federal Home Loan Bank
borrowings.
PNC issued $3.25 billion of senior notes in 2010 as described
further in the Liquidity Risk Management section of this
Item 7, which also describes other actions we took in 2010
that impacted our borrowed funds balances.
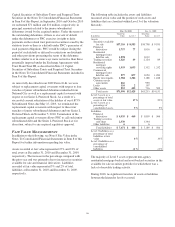
Capital
We manage our capital position by making adjustments to our
balance sheet size and composition, issuing debt, equity or
hybrid instruments, executing treasury stock transactions,
managing dividend policies and retaining earnings. PNC
increased common equity during 2010 as outlined below.
41