PNC Bank 2010 Annual Report Download - page 199
Download and view the complete annual report
Please find page 199 of the 2010 PNC Bank annual report below. You can navigate through the pages in the report by either clicking on the pages listed below, or by using the keyword search tool below to find specific information within the annual report.-
 1
1 -
2
-
3
-
4
-
5
-
6
-
7
-
8
-
9
-
10
-
11
-
12
-
13
-
14
-
15
-
16
-
17
-
18
-
19
-
20
-
21
-
22
-
23
-
24
-
25
-
26
-
27
-
28
-
29
-
30
-
31
-
32
-
33
-
34
-
35
-
36
-
37
-
38
-
39
-
40
-
41
-
42
-
43
-
44
-
45
-
46
-
47
-
48
-
49
-
50
-
51
-
52
-
53
-
54
-
55
-
56
-
57
-
58
-
59
-
60
-
61
-
62
-
63
-
64
-
65
-
66
-
67
-
68
-
69
-
70
-
71
-
72
-
73
-
74
-
75
-
76
-
77
-
78
-
79
-
80
-
81
-
82
-
83
-
84
-
85
-
86
-
87
-
88
-
89
-
90
-
91
-
92
-
93
-
94
-
95
-
96
-
97
-
98
-
99
-
100
-
101
-
102
-
103
-
104
-
105
-
106
-
107
-
108
-
109
-
110
-
111
-
112
-
113
-
114
-
115
-
116
-
117
-
118
-
119
-
120
-
121
-
122
-
123
-
124
-
125
-
126
-
127
-
128
-
129
-
130
-
131
-
132
-
133
-
134
-
135
-
136
-
137
-
138
-
139
-
140
-
141
-
142
-
143
-
144
-
145
-
146
-
147
-
148
-
149
-
150
-
151
-
152
-
153
-
154
-
155
-
156
-
157
-
158
-
159
-
160
-
161
-
162
-
163
-
164
-
165
-
166
-
167
-
168
-
169
-
170
-
171
-
172
-
173
-
174
-
175
-
176
-
177
-
178
-
179
-
180
-
181
-
182
-
183
-
184
-
185
-
186
-
187
-
188
-
 189
189 -
 190
190 -
 191
191 -
 192
192 -
 193
193 -
 194
194 -
 195
195 -
 196
196 -
 197
197 -
 198
198 -
 199
199 -
 200
200 -
 201
201 -
 202
202 -
 203
203 -
 204
204 -
 205
205 -
 206
206 -
 207
207 -
 208
208 -
 209
209 -
210
-
211
-
212
-
213
-
214
 |
 |

S
UMMARY
O
F
L
OAN
L
OSS
E
XPERIENCE
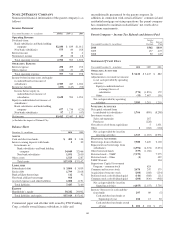
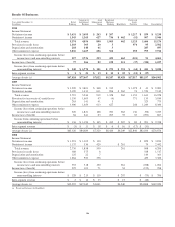
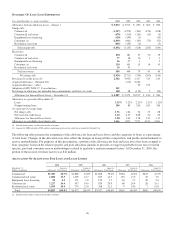
Year ended December 31 - dollars in millions 2010 2009 2008 2007 2006
Allowance for loan and lease losses – January 1 $ 5,072 $ 3,917 $ 830 $ 560 $ 596
Charge-offs
Commercial (1,227) (1,276) (301) (156) (108)
Commercial real estate (670) (510) (165) (16) (3)
Equipment lease financing (120) (149) (3) (14)
Consumer (a) (1,069) (961) (143) (73) (52)
Residential real estate (406) (259) (6) (3)
Total charge-offs (3,492) (3,155) (618) (245) (180)
Recoveries
Commercial 294 181 53 30 19
Commercial real estate 77 38 10 1 1
Equipment lease financing 56 27 1 5
Consumer (a) 110 105 15 14 15
Residential real estate 19 93
Total recoveries 556 444 79 45 40
Net charge-offs (2,936) (2,711) (539) (200) (140)
Provision for credit losses (b) 2,502 3,930 1,517 315 124
Acquired allowance – National City (112) 2,224
Acquired allowance – other 20 152
Adoption of ASU 2009-17, Consolidations 141
Net change in allowance for unfunded loan commitments and letters of credit 108 48 (135) 3 (20)
Allowance for loan and lease losses – December 31 $ 4,887 $ 5,072 $3,917 $ 830 $ 560
Allowance as a percent of December 31:
Loans 3.25% 3.22% 2.23% 1.21% 1.12%
Nonperforming loans 109 89 236 183 350
As a percent of average loans
Net charge-offs 1.91 1.64 .74 .32 .28
Provision for credit losses 1.63 2.37 2.09 .50 .25
Allowance for loan and lease losses 3.18 3.06 5.38 1.33 1.13
Allowance as a multiple of net charge-offs 1.66x 1.87x 7.27x 4.15x 4.00x
(a) Includes home equity, credit card and other consumer.
(b) Amount for 2008 included a $504 million conforming provision for credit losses related to National City.
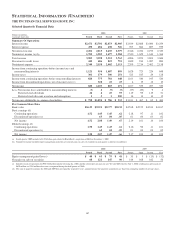
The following table presents the assignment of the allowance for loan and lease losses and the categories of loans as a percentage
of total loans. Changes in the allocation over time reflect the changes in loan portfolio composition, risk profile and refinements to
reserve methodologies. For purposes of this presentation, a portion of the allowance for loan and lease losses has been assigned to
loan categories based on the relative specific and pool allocation amounts to provide coverage for probable losses not covered in
specific, pool and consumer reserve methodologies related to qualitative and measurement factors. At December 31, 2010, the
portion of the reserves for these factors was $42 million.
A
LLOCATION
O
F
A
LLOWANCE
F
OR
L
OAN AND
L
EASE
L
OSSES
2010 2009 2008 2007 2006
December 31
Dollars in millions Allowance
Loans to
Total Loans Allowance
Loans to
Total Loans Allowance
Loans to
Total Loans Allowance
Loans to
Total Loans Allowance
Loans to
Total Loans
Commercial $1,387 36.7% $1,869 34.8% $1,668 39.4% $564 42.4% $447 41.7%
Commercial real estate 1,086 11.9 1,305 14.7 833 14.7 153 13.0 30 7.0
Equipment lease financing 94 4.2 171 3.9 179 3.7 36 3.7 48 5.6
Consumer (a) 1,227 36.6 957 34.0 929 29.9 68 26.9 28 33.1
Residential real estate 1,093 10.6 770 12.6 308 12.3 9 14.0 7 12.6
Total $4,887 100.0% $5,072 100.0% $3,917 100.0% $830 100.0% $560 100.0%
(a) Includes home equity, credit card and other consumer.
191