PNC Bank 2010 Annual Report Download - page 64
Download and view the complete annual report
Please find page 64 of the 2010 PNC Bank annual report below. You can navigate through the pages in the report by either clicking on the pages listed below, or by using the keyword search tool below to find specific information within the annual report.-
 1
1 -
2
-
3
-
4
-
5
-
6
-
7
-
8
-
9
-
10
-
11
-
12
-
13
-
14
-
15
-
16
-
17
-
18
-
19
-
20
-
21
-
22
-
23
-
24
-
25
-
26
-
27
-
28
-
29
-
30
-
31
-
32
-
33
-
34
-
35
-
36
-
37
-
38
-
39
-
40
-
41
-
42
-
43
-
44
-
45
-
46
-
47
-
48
-
49
-
50
-
51
-
52
-
53
-
 54
54 -
 55
55 -
 56
56 -
 57
57 -
 58
58 -
 59
59 -
 60
60 -
 61
61 -
 62
62 -
 63
63 -
 64
64 -
 65
65 -
 66
66 -
 67
67 -
 68
68 -
 69
69 -
 70
70 -
 71
71 -
 72
72 -
 73
73 -
 74
74 -
75
-
76
-
77
-
78
-
79
-
80
-
81
-
82
-
83
-
84
-
85
-
86
-
87
-
88
-
89
-
90
-
91
-
92
-
93
-
94
-
95
-
96
-
97
-
98
-
99
-
100
-
101
-
102
-
103
-
104
-
105
-
106
-
107
-
108
-
109
-
110
-
111
-
112
-
113
-
114
-
115
-
116
-
117
-
118
-
119
-
120
-
121
-
122
-
123
-
124
-
125
-
126
-
127
-
128
-
129
-
130
-
131
-
132
-
133
-
134
-
135
-
136
-
137
-
138
-
139
-
140
-
141
-
142
-
143
-
144
-
145
-
146
-
147
-
148
-
149
-
150
-
151
-
152
-
153
-
154
-
155
-
156
-
157
-
158
-
159
-
160
-
161
-
162
-
163
-
164
-
165
-
166
-
167
-
168
-
169
-
170
-
171
-
172
-
173
-
174
-
175
-
176
-
177
-
178
-
179
-
180
-
181
-
182
-
183
-
184
-
185
-
186
-
187
-
188
-
189
-
190
-
191
-
192
-
193
-
194
-
195
-
196
-
197
-
198
-
199
-
200
-
201
-
202
-
203
-
204
-
205
-
206
-
207
-
208
-
209
-
210
-
211
-
212
-
213
-
214
 |
 |

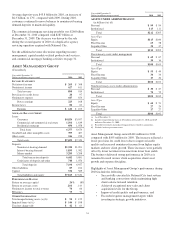
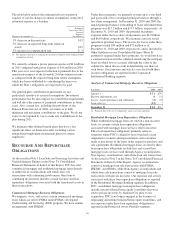
R
ESIDENTIAL
M
ORTGAGE
B
ANKING
(Unaudited)
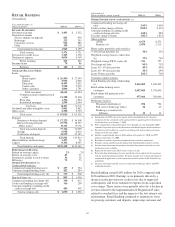
Year ended December 31
Dollars in millions, except as noted 2010 2009
I
NCOME
S
TATEMENT
Net interest income $ 267 $ 332
Noninterest income
Loan servicing revenue
Servicing fees 242 222
Net MSR hedging gains 245 355
Loan sales revenue 231 435
Other 18 (16)
Total noninterest income 736 996
Total revenue 1,003 1,328
Provision for (recoveries of) credit losses 5(4)
Noninterest expense 565 632
Pretax earnings 433 700
Income taxes 158 265
Earnings $ 275 $ 435
A
VERAGE
B
ALANCE
S
HEET
Portfolio loans $2,649 $1,957
Loans held for sale 1,322 2,204
Mortgage servicing rights (MSR) 1,017 1,297
Other assets 4,259 2,962
Total assets $9,247 $8,420
Deposits $2,716 $4,135
Borrowings and other liabilities 2,823 2,924
Capital 1,200 1,359
Total liabilities and equity $6,739 $8,418
P
ERFORMANCE
R
ATIOS
Return on average capital 23% 32%
Return on average assets 2.97 5.17
Noninterest income to total revenue 73 75
Efficiency 56 48
R
ESIDENTIAL
M
ORTGAGE
S
ERVICING
P
ORTFOLIO
(in billions)
Beginning of period $ 145 $ 173
Acquisitions/additions 10 20
Repayments/transfers (30) (40)
Servicing sale (8)
End of period $ 125 $ 145
Servicing portfolio statistics: (a)
Fixed rate 89% 88%
Adjustable rate/balloon 11% 12%
Weighted average interest rate 5.62% 5.82%
MSR capitalized value (in billions) $ 1.0 $ 1.3
MSR capitalization value (in basis points) 82 91
Weighted average servicing fee (in basis
points) 30 30
O
THER
I
NFORMATION
Loan origination volume (in billions) $ 10.5 $ 19.1
Percentage of originations represented by:
Agency and government programs 99% 97%
Refinance volume 74% 72%
Total nonperforming assets (a) (b) $ 349 $ 370
Impaired loans (a) (c) $ 161 $ 369
(a) As of December 31.
(b) Includes nonperforming loans of $109 million at December 31, 2010 and $215
million at December 31, 2009.
(c) Recorded investment of purchased impaired loans related to acquisitions.
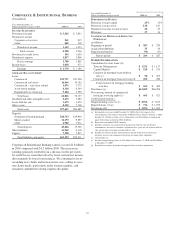
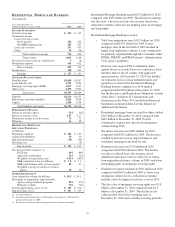
Residential Mortgage Banking earned $275 million for 2010
compared with $435 million in 2009. The decline in earnings
was driven by a decrease in loan sales revenue from lower
origination volumes and lower net hedging gains on mortgage
servicing rights.
Residential Mortgage Banking overview:
• Total loan originations were $10.5 billion for 2010
compared with $19.1 billion for 2009. Lower
mortgage rates in the first half of 2009 resulted in
higher loan origination volumes. Loans continued to
be primarily originated through direct channels under
FNMA, FHLMC and FHA/Veterans’ Administration
(VA) agency guidelines.
• Investors may request PNC to indemnify them
against losses on certain loans or to repurchase loans
that they believe do not comply with applicable
representations. At December 31, 2010, the liability
for estimated losses on loan indemnification and
repurchase claims for the Residential Mortgage
Banking business segment was $144 million
compared with $229 million at December 31, 2009.
See the Recourse and Repurchase Obligations section
of this Item 7 and Note 23 Commitments and
Guarantees in the Notes To Consolidated Financial
Statements included in Item 8 of this Report for
additional information.
• Residential mortgage loans serviced for others totaled
$125 billion at December 31, 2010 compared with
$145 billion at December 31, 2009. Payoffs
continued to outpace new direct loan origination
volume during 2010.
• Net interest income was $267 million for 2010
compared with $332 million for 2009. The decrease
resulted from lower escrow deposit balances and
residential mortgage loans held for sale.
• Noninterest income was $736 million in 2010
compared with $996 million in 2009. The decline
was due to reduced loan sales revenue, net of
additional repurchase reserves, reflective of strong
loan origination refinance volume in 2009, and lower
net hedging gains on mortgage servicing rights.
• Noninterest expense declined to $565 million in 2010
compared with $632 million in 2009 as lower loan
origination volume drove a reduction in expense,
partially offset by higher foreclosure costs in 2010.
• The fair value of mortgage servicing rights was $1.0
billion at December 31, 2010 compared with $1.3
billion at December 31, 2009. The decline in fair
value resulted from lower mortgage rates at
December 31, 2010 and a smaller servicing portfolio.
56