PNC Bank 2010 Annual Report Download - page 177
Download and view the complete annual report
Please find page 177 of the 2010 PNC Bank annual report below. You can navigate through the pages in the report by either clicking on the pages listed below, or by using the keyword search tool below to find specific information within the annual report.-
 1
1 -
2
-
3
-
4
-
5
-
6
-
7
-
8
-
9
-
10
-
11
-
12
-
13
-
14
-
15
-
16
-
17
-
18
-
19
-
20
-
21
-
22
-
23
-
24
-
25
-
26
-
27
-
28
-
29
-
30
-
31
-
32
-
33
-
34
-
35
-
36
-
37
-
38
-
39
-
40
-
41
-
42
-
43
-
44
-
45
-
46
-
47
-
48
-
49
-
50
-
51
-
52
-
53
-
54
-
55
-
56
-
57
-
58
-
59
-
60
-
61
-
62
-
63
-
64
-
65
-
66
-
67
-
68
-
69
-
70
-
71
-
72
-
73
-
74
-
75
-
76
-
77
-
78
-
79
-
80
-
81
-
82
-
83
-
84
-
85
-
86
-
87
-
88
-
89
-
90
-
91
-
92
-
93
-
94
-
95
-
96
-
97
-
98
-
99
-
100
-
101
-
102
-
103
-
104
-
105
-
106
-
107
-
108
-
109
-
110
-
111
-
112
-
113
-
114
-
115
-
116
-
117
-
118
-
119
-
120
-
121
-
122
-
123
-
124
-
125
-
126
-
127
-
128
-
129
-
130
-
131
-
132
-
133
-
134
-
135
-
136
-
137
-
138
-
139
-
140
-
141
-
142
-
143
-
144
-
145
-
146
-
147
-
148
-
149
-
150
-
151
-
152
-
153
-
154
-
155
-
156
-
157
-
158
-
159
-
160
-
161
-
162
-
163
-
164
-
165
-
166
-
 167
167 -
 168
168 -
 169
169 -
 170
170 -
 171
171 -
 172
172 -
 173
173 -
 174
174 -
 175
175 -
 176
176 -
 177
177 -
 178
178 -
 179
179 -
 180
180 -
 181
181 -
 182
182 -
 183
183 -
 184
184 -
 185
185 -
 186
186 -
 187
187 -
188
-
189
-
190
-
191
-
192
-
193
-
194
-
195
-
196
-
197
-
198
-
199
-
200
-
201
-
202
-
203
-
204
-
205
-
206
-
207
-
208
-
209
-
210
-
211
-
212
-
213
-
214
 |
 |

N
OTE
19 O
THER
C
OMPREHENSIVE
I
NCOME
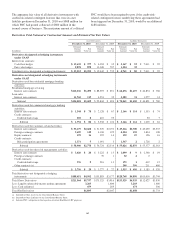
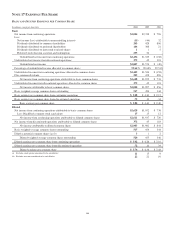
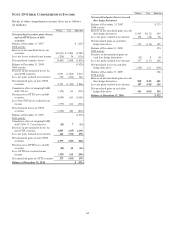
Details of other comprehensive income (loss) are as follows
(in millions):
Pretax Tax After-tax
Net unrealized securities gains (losses)
and net OTTI losses on debt
securities
Balance at December 31, 2007 $ (167)
2008 activity
Increase in net unrealized losses for
securities $(5,673) $ 2,084 (3,589)
Less: net losses realized in net income (206) 76 (130)
Net unrealized securities losses (5,467) 2,008 (3,459)
Balance at December 31, 2008 (3,626)
2009 activity
Decrease in net unrealized losses for
non-OTTI securities 5,075 (1,863) 3,212
Less: net gains realized in net income 550 (204) 346
Net unrealized gains on non-OTTI
securities 4,525 (1,659) 2,866
Cumulative effect of adopting FASB
ASC 320-10 (174) 64 (110)
Net increase in OTTI losses on debt
securities (1,699) 630 (1,069)
Less: Net OTTI losses realized in net
income (577) 214 (363)
Net unrealized losses on OTTI
securities (1,296) 480 (816)
Balance at December 31, 2009 (1,576)
2010 activity
Cumulative effect of adopting FASB
ASU 2009-17, Consolidations (20) 7 (13)
Decrease in net unrealized losses for
non-OTTI securities 1,803 (665) 1,138
Less: net gains realized in net income 426 (156) 270
Net unrealized gains on non-OTTI
securities 1,377 (509) 868
Net increase in OTTI losses on debt
securities (50) 14 (36)
Less: OTTI losses realized in net
income (325) 119 (206)
Net unrealized gains on OTTI securities 275 (105) 170
Balance at December 31, 2010 $ (551)
Pretax Tax After-tax
Net unrealized gains (losses) on cash
flow hedge derivatives
Balance at December, 31, 2007 $ 175
2008 activity
Increase in net unrealized gains on cash
flow hedge derivatives $ 467 $(172) 295
Less: net gains realized in net income 152 (56) 96
Net unrealized gains on cash flow
hedge derivatives 315 (116) 199
Balance at December 31, 2008 374
2009 activity
Decrease in net unrealized gains on
cash flow hedge derivatives (12) 4 (8)
Less: net gains realized in net income 317 (117) 200
Net unrealized losses on cash flow
hedge derivatives (329) 121 (208)
Balance at December 31, 2009 166
2010 activity
Increase in net unrealized gains on cash
flow hedge derivatives 948 (347) 601
Less: net gains realized in net income 387 (142) 245
Net unrealized gains on cash flow
hedge derivatives 561 (205) 356
Balance at December 31, 2010 $ 522
169