PNC Bank 2010 Annual Report Download - page 132
Download and view the complete annual report
Please find page 132 of the 2010 PNC Bank annual report below. You can navigate through the pages in the report by either clicking on the pages listed below, or by using the keyword search tool below to find specific information within the annual report.-
 1
1 -
2
-
3
-
4
-
5
-
6
-
7
-
8
-
9
-
10
-
11
-
12
-
13
-
14
-
15
-
16
-
17
-
18
-
19
-
20
-
21
-
22
-
23
-
24
-
25
-
26
-
27
-
28
-
29
-
30
-
31
-
32
-
33
-
34
-
35
-
36
-
37
-
38
-
39
-
40
-
41
-
42
-
43
-
44
-
45
-
46
-
47
-
48
-
49
-
50
-
51
-
52
-
53
-
54
-
55
-
56
-
57
-
58
-
59
-
60
-
61
-
62
-
63
-
64
-
65
-
66
-
67
-
68
-
69
-
70
-
71
-
72
-
73
-
74
-
75
-
76
-
77
-
78
-
79
-
80
-
81
-
82
-
83
-
84
-
85
-
86
-
87
-
88
-
89
-
90
-
91
-
92
-
93
-
94
-
95
-
96
-
97
-
98
-
99
-
100
-
101
-
102
-
103
-
104
-
105
-
106
-
107
-
108
-
109
-
110
-
111
-
112
-
113
-
114
-
115
-
116
-
117
-
118
-
119
-
120
-
121
-
 122
122 -
 123
123 -
 124
124 -
 125
125 -
 126
126 -
 127
127 -
 128
128 -
 129
129 -
 130
130 -
 131
131 -
 132
132 -
 133
133 -
 134
134 -
 135
135 -
 136
136 -
 137
137 -
 138
138 -
 139
139 -
 140
140 -
 141
141 -
 142
142 -
143
-
144
-
145
-
146
-
147
-
148
-
149
-
150
-
151
-
152
-
153
-
154
-
155
-
156
-
157
-
158
-
159
-
160
-
161
-
162
-
163
-
164
-
165
-
166
-
167
-
168
-
169
-
170
-
171
-
172
-
173
-
174
-
175
-
176
-
177
-
178
-
179
-
180
-
181
-
182
-
183
-
184
-
185
-
186
-
187
-
188
-
189
-
190
-
191
-
192
-
193
-
194
-
195
-
196
-
197
-
198
-
199
-
200
-
201
-
202
-
203
-
204
-
205
-
206
-
207
-
208
-
209
-
210
-
211
-
212
-
213
-
214
 |
 |

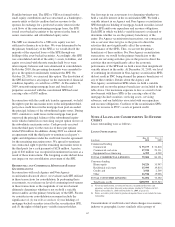
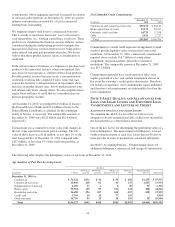
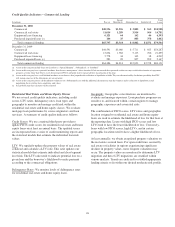
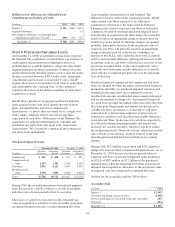
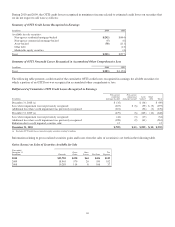
Credit Quality Indicators – Commercial Lending
In millions Pass (a)
Special
Mention (b) Substandard (c) Doubtful (d)
Total
Loans
December 31, 2010
Commercial $48,556 $1,926 $ 3,883 $ 563 $54,928
Commercial real estate 11,014 1,289 3,914 564 16,781
Equipment lease financing 6,121 64 162 46 6,393
Purchased impaired loans (e) 106 35 883 378 1,402
Total commercial lending $65,797 $3,314 $ 8,842 $1,551 $79,504
December 31, 2009
Commercial $44,591 $3,060 $ 5,711 $ 925 $54,287
Commercial real estate 13,834 1,782 5,113 766 21,495
Equipment lease financing 5,778 44 342 38 6,202
Purchased impaired loans (e) 283 28 857 999 2,167
Total commercial lending $64,486 $4,914 $12,023 $2,728 $84,151
(a) Assets in this category include loans not classified as “Special Mention”, “Substandard”, or “Doubtful.”
(b) Assets in this category have a potential weakness that deserves management’s close attention. If left uncorrected these potential weaknesses may result in deterioration of repayment
prospects at some future date. These assets do not expose PNC to sufficient risk to warrant adverse classification at this time.
(c) Assets in this category have a well-defined weakness or weaknesses that jeopardize the collection or liquidation of debt. They are characterized by the distinct possibility that PNC
will sustain some loss if the deficiencies are not corrected.
(d) Assets in this category possess all the inherent weaknesses of a Substandard asset with the additional characteristics that the weakness makes collection or liquidation in full
improbable due to existing facts, conditions, and values.
(e) It is probable that these amounts will be collected.
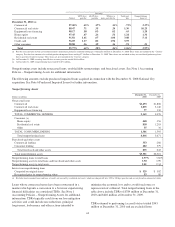
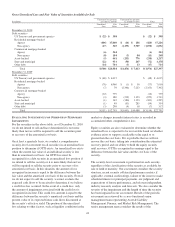
Residential Real Estate and Home Equity Classes
We use several credit quality indicators, including credit
scores, LTV ratios, delinquency rates, loan types and
geography to monitor and manage credit risk within the
residential real estate and home equity classes. We evaluate
mortgage loan performance by source originators and loan
servicers. A summary of credit quality indicators follows:
Credit Scores: We use a national third-party provider to
update FICO credit scores for residential real estate and home
equity loans on at least an annual basis. The updated scores
are incorporated into a series of credit monitoring reports and
the statistical models that estimate the individual loan risk
values.
LTV: We regularly update the property values of real estate
collateral and calculate a LTV ratio. This ratio updates our
statistical models that estimate individual and class/segment
level risk. The LTV ratio tends to indicate potential loss on a
given loan and the borrower’s likelihood to make payment
according to the contractual obligations.
Delinquency Rates: We monitor levels of delinquency rates
for residential real estate and home equity loans.
Geography: Geographic concentrations are monitored to
evaluate and manage exposures. Loan purchase programs are
sensitive to, and focused within, certain regions to manage
geographic exposures and associated risks.
The combination of FICO scores, LTV ratios and geographic
location assigned to residential real estate and home equity
loans are used to estimate the likelihood of loss for that loan at
the reporting date. Loans with high FICO scores and low
LTVs tend to have the lower likelihood of loss. Conversely,
loans with low FICO scores, high LTVs, and in certain
geographic locations tend to have a higher likelihood of loss.
At least annually, we obtain an updated property valuation on
the real estate secured loans. For open credit lines secured by
real estate or facilities in regions experiencing significant
declines in property values, more frequent valuations may
occur. The property values are monitored to determine LTV
migration and those LTV migrations are stratified within
various markets. Trends are analyzed to establish appropriate
lending criteria to fit within our desired moderate risk profile.
124