ICICI Bank 2012 Annual Report Download - page 98
Download and view the complete annual report
Please find page 98 of the 2012 ICICI Bank annual report below. You can navigate through the pages in the report by either clicking on the pages listed below, or by using the keyword search tool below to find specific information within the annual report.-
 1
1 -
2
-
3
-
4
-
5
-
6
-
7
-
8
-
9
-
10
-
11
-
12
-
13
-
14
-
15
-
16
-
17
-
18
-
19
-
20
-
21
-
22
-
23
-
24
-
25
-
26
-
27
-
28
-
29
-
30
-
31
-
32
-
33
-
34
-
35
-
36
-
37
-
38
-
39
-
40
-
41
-
42
-
43
-
44
-
45
-
46
-
47
-
48
-
49
-
50
-
51
-
52
-
53
-
54
-
55
-
56
-
57
-
58
-
59
-
60
-
61
-
62
-
63
-
64
-
65
-
66
-
67
-
68
-
69
-
70
-
71
-
72
-
73
-
74
-
75
-
76
-
77
-
78
-
79
-
80
-
81
-
82
-
83
-
84
-
85
-
86
-
87
-
 88
88 -
 89
89 -
 90
90 -
 91
91 -
 92
92 -
 93
93 -
 94
94 -
 95
95 -
 96
96 -
 97
97 -
 98
98 -
 99
99 -
 100
100 -
 101
101 -
 102
102 -
 103
103 -
 104
104 -
 105
105 -
 106
106 -
 107
107 -
 108
108 -
109
-
110
-
111
-
112
-
113
-
114
-
115
-
116
-
117
-
118
-
119
-
120
-
121
-
122
-
123
-
124
-
125
-
126
-
127
-
128
-
129
-
130
-
131
-
132
-
133
-
134
-
135
-
136
-
137
-
138
-
139
-
140
-
141
-
142
-
143
-
144
-
145
-
146
-
147
-
148
-
149
-
150
-
151
-
152
-
153
-
154
-
155
-
156
-
157
-
158
-
159
-
160
-
161
-
162
-
163
-
164
-
165
-
166
-
167
-
168
-
169
-
170
-
171
-
172
-
173
-
174
-
175
-
176
-
177
-
178
-
179
-
180
-
181
-
182
-
183
-
184
-
185
-
186
-
187
-
188
-
189
-
190
-
191
-
192
-
193
-
194
-
195
-
196
-
197
-
198
-
199
-
200
-
201
-
202
-
203
-
204
-
205
-
206
-
207
-
208
-
209
-
210
-
211
-
212
 |
 |

F20
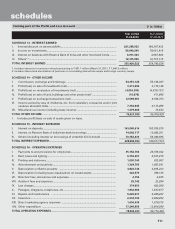
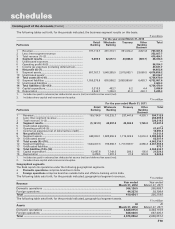
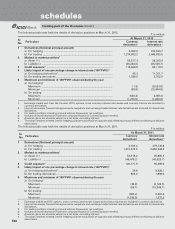
The following table sets forth, for the periods indicated, capital expenditure and depreciation thereon for the geographical
segments.
` in million
Capital expenditure incurred during Depreciation provided during
Year ended
March 31, 2012 Year ended
March 31, 2011
Year ended
March 31, 2012
Year ended
March 31, 2011
Domestic operations ........................ 3,616.0 21,484.5 5,211.8 5,590.1
Foreign operations ........................... 72.8 44.7 33.5 34.3
Total .................................................. 3,688.8 21,529.2 5,245.3 5,624.4
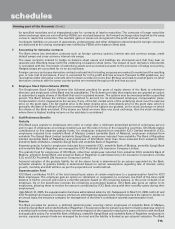
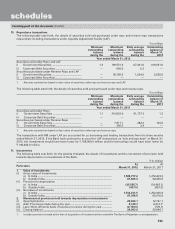
5. Maturity pattern
xIn compiling the information of maturity pattern, certain estimates and assumptions have been made by the management.
xAssets and liabilities in foreign currency exclude off-balance sheet assets and liabilities.
The following table sets forth, the maturity pattern of assets and liabilities of the Bank at March 31, 2012.
` in million
Maturity buckets
Loans &
Advances 2
Investment
securities2
Deposits2Borrowings2,3 Total foreign
currency
assets
Total foreign
currency
liabilities
Day 11 ................................................. 7,738.5 35,284.9 19,792.9 — 30,222.0 2,688.8
2 to 7 days1 ........................................ 13,041.4 217,729.6 44,612.6 174,543.1 69,821.6 9,310.3
8 to 14 days1 ...................................... 13,191.0 49,505.7 54,744.2 2,543.6 10,671.6 7,216.8
15 to 28 days ..................................... 39,001.7 95,723.5 97,134.4 26,841.4 21,209.7 25,492.3
29 days to 3 months .......................... 142,209.3 77,392.4 273,131.8 80,937.6 67,038.9 114,905.9
3 to 6 months ..................................... 188,828.5 87,627.9 288,254.6 141,606.5 73,969.8 129,864.6
6 months to 1 year ............................ 336,379.4 149,466.7 452,112.8 223,622.4 95,326.5 241,781.4
1 to 3 years ........................................ 1,043,883.5 245,244.2 690,126.6 173,520.5 172,330.3 197,466.2
3 to 5 years ........................................ 388,469.1 152,923.0 228,550.3 197,146.0 147,925.4 140,532.7
Above 5 years .................................... 364,534.2 484,702.5 406,539.4 380,888.0 254,969.4 151,621.8
Total ................................................... 2,537,276.6 1,595,600.4 2,554,999.6 1,401,649.1 943,485.2 1,020,880.8
1. The aforesaid disclosure is in accordance with the revised maturity buckets as per the RBI circular no. DBOD.BP.BC.22/21.04.018/2009-10
dated July 1, 2009.
2. Includes foreign currency balances.
3. Includes borrowings in the nature of subordinated debts and preference shares as per RBI guidelines vide circular no. DBOD.BP.BC no.
81/21.01.002/2009-10.
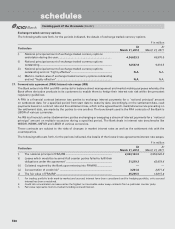
The following table sets forth the maturity pattern of assets and liabilities of the Bank at March 31, 2011.
` in million
Maturity buckets
Loans &
Advances2
Investment
securities2
Deposits2Borrowings2,3 Total foreign
currency
assets
Total foreign
currency
liabilities
Day 11 ................................................. 9,280.7 49,614.9 45,279.5 913.1 57,011.6 35,628.8
2 to 7 days1 ........................................ 12,637.9 18,462.6 63,935.7 3,028.3 27,144.3 6,388.6
8 to 14 days1 ...................................... 14,881.9 24,073.6 54,938.5 7,270.2 11,484.9 8,654.3
15 to 28 days ..................................... 26,058.4 92,754.3 64,625.1 23,284.7 13,578.6 16,578.0
29 days to 3 months .......................... 149,170.8 96,887.8 212,721.9 92,328.3 58,021.5 78,777.9
3 to 6 months ..................................... 190,491.4 76,649.1 178,717.0 108,229.9 29,419.1 114,994.8
6 months to 1 year ............................ 260,740.5 120,666.5 374,534.2 138,828.8 53,188.7 153,395.3
1 to 3 years ........................................ 889,201.1 359,736.2 1,177,196.9 229,022.1 214,539.8 202,968.1
3 to 5 years ........................................ 342,603.1 106,907.7 33,946.6 110,920.2 131,949.7 80,851.3
Above 5 years .................................... 268,593.1 401,106.8 50,125.7 381,717.2 170,112.0 138,821.6
Total .................................................. 2,163,659.0 1,346,859.6 2,256,021.1 1,095,542.8 766,450.2 837,058.7
1. The aforesaid disclosure is in accordance with the revised maturity buckets as per the RBI circular no. DBOD.
BP.BC.22/21.04.018/2009-10 dated July 1, 2009.
2. Includes foreign currency balances.
3. Includes borrowings in the nature of subordinated debts and preference shares as per RBI guidelines vide circular no. DBOD.
BP.BC no. 81/21.01.002/2009-10.
forming part of the Accounts (Contd.)
schedules