ICICI Bank 2012 Annual Report Download - page 104
Download and view the complete annual report
Please find page 104 of the 2012 ICICI Bank annual report below. You can navigate through the pages in the report by either clicking on the pages listed below, or by using the keyword search tool below to find specific information within the annual report.-
 1
1 -
2
-
3
-
4
-
5
-
6
-
7
-
8
-
9
-
10
-
11
-
12
-
13
-
14
-
15
-
16
-
17
-
18
-
19
-
20
-
21
-
22
-
23
-
24
-
25
-
26
-
27
-
28
-
29
-
30
-
31
-
32
-
33
-
34
-
35
-
36
-
37
-
38
-
39
-
40
-
41
-
42
-
43
-
44
-
45
-
46
-
47
-
48
-
49
-
50
-
51
-
52
-
53
-
54
-
55
-
56
-
57
-
58
-
59
-
60
-
61
-
62
-
63
-
64
-
65
-
66
-
67
-
68
-
69
-
70
-
71
-
72
-
73
-
74
-
75
-
76
-
77
-
78
-
79
-
80
-
81
-
82
-
83
-
84
-
85
-
86
-
87
-
88
-
89
-
90
-
91
-
92
-
93
-
 94
94 -
 95
95 -
 96
96 -
 97
97 -
 98
98 -
 99
99 -
 100
100 -
 101
101 -
 102
102 -
 103
103 -
 104
104 -
 105
105 -
 106
106 -
 107
107 -
 108
108 -
 109
109 -
 110
110 -
 111
111 -
 112
112 -
 113
113 -
 114
114 -
115
-
116
-
117
-
118
-
119
-
120
-
121
-
122
-
123
-
124
-
125
-
126
-
127
-
128
-
129
-
130
-
131
-
132
-
133
-
134
-
135
-
136
-
137
-
138
-
139
-
140
-
141
-
142
-
143
-
144
-
145
-
146
-
147
-
148
-
149
-
150
-
151
-
152
-
153
-
154
-
155
-
156
-
157
-
158
-
159
-
160
-
161
-
162
-
163
-
164
-
165
-
166
-
167
-
168
-
169
-
170
-
171
-
172
-
173
-
174
-
175
-
176
-
177
-
178
-
179
-
180
-
181
-
182
-
183
-
184
-
185
-
186
-
187
-
188
-
189
-
190
-
191
-
192
-
193
-
194
-
195
-
196
-
197
-
198
-
199
-
200
-
201
-
202
-
203
-
204
-
205
-
206
-
207
-
208
-
209
-
210
-
211
-
212
 |
 |

F26
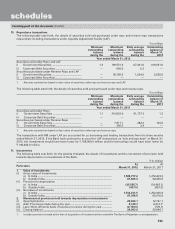
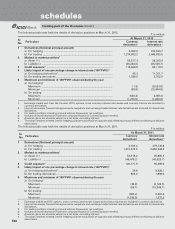
The following table sets forth the details of derivative positions at March 31, 2012. ` in million
Sr. Particulars
No.
At March 31, 2012
Currency
derivatives1
Interest rate
derivatives 2
1 Derivatives (Notional principal amount)
a) For hedging ............................................................................................. 5,062.2 312,533.7
b) For trading .............................................................................................. 1,214,603.2 2,446,693.6
2 Marked to market positions3
a) Asset (+) ................................................................................................. 59,517.3 28,323.4
b) Liability (-) ............................................................................................... (46,244.0) (26,520.7)
3 Credit exposure4 ......................................................................................... 118,689.8 80,110.9
4 Likely impact of one percentage change in interest rate (100*PV01)5
a) On hedging derivatives6 ......................................................................... 45.3 11,751.7
b) On trading derivatives ............................................................................ 1,038.9 2,752.9
5 Maximum and minimum of 100*PV01 observed during the year
a) On hedging6
Maximum ................................................................................................ (1.3) (9,523.0)
Minimum ................................................................................................. (50.8) (13,444.8)
b) On trading
Maximum ................................................................................................ (620.3) 2,956.8
Minimum ................................................................................................. (1,270.0) (1,899.8)
1. Exchange traded and Over the Counter (OTC) options, cross currency interest rate swaps and currency futures are included in
currency derivatives.
2. Interest rate swaps, forward rate agreements, swaptions and exchange traded interest rate derivatives are included in interest rate
derivatives.
3. For trading portfolio including accrued interest. Represents net positions.
4. Includes accrued interest and has been computed based on Current Exposure method.
5. Amounts given are absolute values on a net basis, excluding options.
6. The swap contracts entered into for hedging purpose would have an opposite and offsetting impact with the underlying on-balance
sheet items.
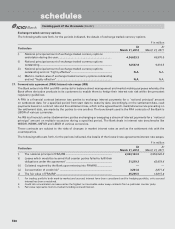
The following table sets forth the details of derivative positions at March 31, 2011. ` in million
Sr. Particulars
No.
At March 31, 2011
Currency
derivatives1
Interest rate
derivatives 2
1 Derivatives (Notional principal amount)
a) For hedging ............................................................................................ 4,105.4 279,739.8
b) For trading ............................................................................................. 1,316,079.5 3,866,544.9
2 Marked to market positions3
a) Asset (+) ................................................................................................ 53,618.2 40,802.3
b) Liability (-) .............................................................................................. (46,478.2) (40,823.7)
3 Credit exposure4 ........................................................................................ 120,177.9 96,389.0
4 Likely impact of one percentage change in interest rate (100*PV01)5
a) On hedging derivatives6 ........................................................................ 39.8 9,828.1
b) On trading derivatives ........................................................................... 854.4 1,898.0
5 Maximum and minimum of 100*PV01 observed during the year
a) On hedging6
Maximum ............................................................................................... (39.8) (6,126.5)
Minimum ................................................................................................ (69.1) (10,546.1)
b) On trading
Maximum ............................................................................................... (802.2) 5,407.4
Minimum ................................................................................................ (1,532.5) 1,572.2
1. Exchange traded and OTC options, cross currency interest rate swaps and currency futures are included in currency derivatives.
2. Interest rate swaps, forward rate agreements, swaptions and exchange traded interest rate derivatives are included in interest rate
derivatives.
3. For trading portfolio including accrued interest. Represents net positions.
4. Includes accrued interest and has been computed based on Current Exposure method.
5. Amounts given are absolute values on a net basis, excluding options.
6. The swap contracts entered into for hedging purpose would have an opposite and offsetting impact with the underlying on-balance
sheet items.
forming part of the Accounts (Contd.)
schedules