ICICI Bank 2012 Annual Report Download - page 105
Download and view the complete annual report
Please find page 105 of the 2012 ICICI Bank annual report below. You can navigate through the pages in the report by either clicking on the pages listed below, or by using the keyword search tool below to find specific information within the annual report.-
 1
1 -
2
-
3
-
4
-
5
-
6
-
7
-
8
-
9
-
10
-
11
-
12
-
13
-
14
-
15
-
16
-
17
-
18
-
19
-
20
-
21
-
22
-
23
-
24
-
25
-
26
-
27
-
28
-
29
-
30
-
31
-
32
-
33
-
34
-
35
-
36
-
37
-
38
-
39
-
40
-
41
-
42
-
43
-
44
-
45
-
46
-
47
-
48
-
49
-
50
-
51
-
52
-
53
-
54
-
55
-
56
-
57
-
58
-
59
-
60
-
61
-
62
-
63
-
64
-
65
-
66
-
67
-
68
-
69
-
70
-
71
-
72
-
73
-
74
-
75
-
76
-
77
-
78
-
79
-
80
-
81
-
82
-
83
-
84
-
85
-
86
-
87
-
88
-
89
-
90
-
91
-
92
-
93
-
94
-
 95
95 -
 96
96 -
 97
97 -
 98
98 -
 99
99 -
 100
100 -
 101
101 -
 102
102 -
 103
103 -
 104
104 -
 105
105 -
 106
106 -
 107
107 -
 108
108 -
 109
109 -
 110
110 -
 111
111 -
 112
112 -
 113
113 -
 114
114 -
 115
115 -
116
-
117
-
118
-
119
-
120
-
121
-
122
-
123
-
124
-
125
-
126
-
127
-
128
-
129
-
130
-
131
-
132
-
133
-
134
-
135
-
136
-
137
-
138
-
139
-
140
-
141
-
142
-
143
-
144
-
145
-
146
-
147
-
148
-
149
-
150
-
151
-
152
-
153
-
154
-
155
-
156
-
157
-
158
-
159
-
160
-
161
-
162
-
163
-
164
-
165
-
166
-
167
-
168
-
169
-
170
-
171
-
172
-
173
-
174
-
175
-
176
-
177
-
178
-
179
-
180
-
181
-
182
-
183
-
184
-
185
-
186
-
187
-
188
-
189
-
190
-
191
-
192
-
193
-
194
-
195
-
196
-
197
-
198
-
199
-
200
-
201
-
202
-
203
-
204
-
205
-
206
-
207
-
208
-
209
-
210
-
211
-
212
 |
 |

F27
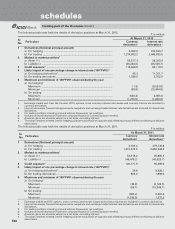
The Bank has exposure in credit derivative instruments including credit default swaps, credit linked notes, collateralised
debt obligations and principal protected structures. The notional principal amount of these credit derivatives outstanding
at March 31, 2012 was Nil (March 31, 2011: ` 10,599.7 million) in funded instruments and ` 10,349.9 million (March 31,
2011: ` 28,168.2 million) in non-funded instruments which includes Nil (March 31, 2011: ` 223.0 million) of protection
bought by the Bank.
The profit and loss impact on the above portfolio on account of mark-to-market and realised profit/losses during the
year ended March 31, 2012 was net profit of ` 561.0 million (March 31, 2011: ` 94.6 million). At March 31, 2012, the
total outstanding mark-to-market position of the above portfolio was a net loss of ` 59.6 million (March 31, 2011: ` 527.9
million). The credit derivatives are marked to market by the Bank based on counter-party valuation quotes, or internal
models using inputs from market sources such as Bloomberg/Reuters, counter-parties and FIMMDA.
The Bank offers deposits to customers of its offshore branches with structured returns linked to interest, forex, credit or
equity benchmarks. The Bank covers these exposures in the inter-bank market. At March 31, 2012, the net open position
on this portfolio was Nil (March 31, 2011: Nil) with mark-to-market gain of ` 24.8 million (March 31, 2011: ` 27.8 million).
The profit and loss impact on account of mark-to-market and realised profit and loss during the year ended March 31,
2012 was a net loss of ` 5.2 million.
The notional principal amount of forex contracts classified as non-trading at March 31, 2012 amounted to ` 745,722.2
million (March 31, 2011: ` 340,828.8 million). For these non-trading forex contracts, at March 31, 2012, marked to market
positions was asset of ` 22,528.9 million (March 31, 2011: ` 2,532.0 million) and liability of ` 12,843.6 million (March 31,
2011: ` 7,333.8 million), credit exposure of ` 42,639.4 million (March 31, 2011: ` 10,873.7 million) and likely impact of one
percentage change in interest rate (100*PV01) was ` (81.6) million (March 31, 2011: ` (9.6) million).
The notional principal amount of forex contracts classified as trading at March 31, 2012 amounted to ` 2,814,328.7
million (March 31, 2011: ` 2,127,789.6 million). For these trading forex contracts, at March 31, 2012, marked to market
position was asset of ` 70,164.7 million (March 31, 2011: ` 39,289.0 million) and liability of ` 66,449.6 million (March 31,
2011: ` 33,916.3 million), credit exposure of ` 135,371.9 million (March 31, 2011: ` 92,213.9 million) and likely impact
of one percentage change in interest rate (100*PV01) was ` (90.1) million (March 31, 2011: ` (45.4) million). The net
overnight open position at March 31, 2012 was ` 299.1 million (March 31, 2011: ` 502.1 million).
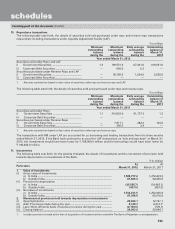
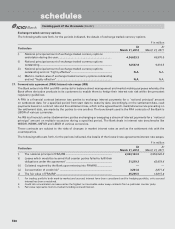
16. Exchange traded interest rate derivatives and currency options
Exchange traded interest rate derivatives
The following table sets forth, for the periods indicated, the details of exchange traded interest rate derivatives.
` in million
Particulars At
March 31, 2012
At
March 31, 2011
i) Notional principal amount of exchange traded interest rate derivatives
undertaken during the year (instrument-wise)
a) Euro dollar futures .................................................................................... ——
b) Treasury note futures – 10 years ............................................................. ——
c) Treasury note futures – 5 years ............................................................... ——
d) Treasury note futures – 2 years ............................................................... ——
e) NSE – GOI Bond futures ........................................................................... ——
ii) Notional principal amount of exchange traded interest rate derivatives
outstanding (instrument-wise)
a) Euro dollar futures .................................................................................... ——
b) Treasury note futures – 10 years ............................................................. ——
c) Treasury note futures – 5 years ............................................................... ——
d) Treasury note futures – 2 years ............................................................... ——
e) NSE – GOI Bond futures .......................................................................... ——
iii) Notional principal amount of exchange traded interest rate derivatives
outstanding and not “highly effective ” .......................................................
N.A. N.A.
iv) Mark-to-market value of exchange traded interest rate derivatives
outstanding and not “highly effective” .........................................................
N.A. N.A.
forming part of the Accounts (Contd.)
schedules