ICICI Bank 2012 Annual Report Download - page 62
Download and view the complete annual report
Please find page 62 of the 2012 ICICI Bank annual report below. You can navigate through the pages in the report by either clicking on the pages listed below, or by using the keyword search tool below to find specific information within the annual report.-
 1
1 -
2
-
3
-
4
-
5
-
6
-
7
-
8
-
9
-
10
-
11
-
12
-
13
-
14
-
15
-
16
-
17
-
18
-
19
-
20
-
21
-
22
-
23
-
24
-
25
-
26
-
27
-
28
-
29
-
30
-
31
-
32
-
33
-
34
-
35
-
36
-
37
-
38
-
39
-
40
-
41
-
42
-
43
-
44
-
45
-
46
-
47
-
48
-
49
-
50
-
51
-
 52
52 -
 53
53 -
 54
54 -
 55
55 -
 56
56 -
 57
57 -
 58
58 -
 59
59 -
 60
60 -
 61
61 -
 62
62 -
 63
63 -
 64
64 -
 65
65 -
 66
66 -
 67
67 -
 68
68 -
 69
69 -
 70
70 -
 71
71 -
 72
72 -
73
-
74
-
75
-
76
-
77
-
78
-
79
-
80
-
81
-
82
-
83
-
84
-
85
-
86
-
87
-
88
-
89
-
90
-
91
-
92
-
93
-
94
-
95
-
96
-
97
-
98
-
99
-
100
-
101
-
102
-
103
-
104
-
105
-
106
-
107
-
108
-
109
-
110
-
111
-
112
-
113
-
114
-
115
-
116
-
117
-
118
-
119
-
120
-
121
-
122
-
123
-
124
-
125
-
126
-
127
-
128
-
129
-
130
-
131
-
132
-
133
-
134
-
135
-
136
-
137
-
138
-
139
-
140
-
141
-
142
-
143
-
144
-
145
-
146
-
147
-
148
-
149
-
150
-
151
-
152
-
153
-
154
-
155
-
156
-
157
-
158
-
159
-
160
-
161
-
162
-
163
-
164
-
165
-
166
-
167
-
168
-
169
-
170
-
171
-
172
-
173
-
174
-
175
-
176
-
177
-
178
-
179
-
180
-
181
-
182
-
183
-
184
-
185
-
186
-
187
-
188
-
189
-
190
-
191
-
192
-
193
-
194
-
195
-
196
-
197
-
198
-
199
-
200
-
201
-
202
-
203
-
204
-
205
-
206
-
207
-
208
-
209
-
210
-
211
-
212
 |
 |

60
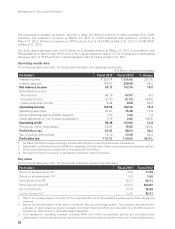
Total liabilities (including capital and reserves) increased by 16.6% from ` 4,062.34 billion at March 31, 2011
to ` 4,736.47 billion at March 31, 2012, primarily due to an increase in borrowings and deposits. Deposits
increased from ` 2,256.02 billion at March 31, 2011 to ` 2,555.00 billion at March 31, 2012. Borrowings,
including subordinated debt and preference share capital, increased from ` 1,095.54 billion at March 31,
2011 to ` 1,401.65 billion at March 31, 2012.
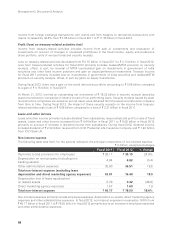
Deposits
Deposits increased by 13.3% from ` 2,256.02 billion at March 31, 2011 to ` 2,555.00 billion at March 31,
2012. Term deposits increased from ` 1,239.55 billion at March 31, 2011 to ` 1,444.81 billion at
March 31, 2012, while savings deposits increased from ` 668.69 billion at March 31, 2011 to ` 760.46 billion at
March 31, 2012 and current deposits increased from ` 347.78 billion at March 31, 2011 to ` 349.73 billion at
March 31, 2012. Total deposits at March 31, 2012 formed 64.6% of the funding (i.e. deposits and borrowings,
including subordinated debt and excluding preference share capital). The current and savings account
deposits increased from ` 1,016.47 billion at March 31, 2011 to ` 1,110.19 billion at March 31, 2012.
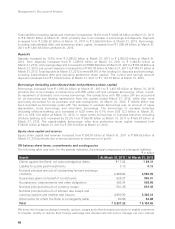
Borrowings (including subordinated debt and preference share capital)
Borrowings increased from ` 1,095.54 billion at March 31, 2011 to ` 1,401.65 billion at March 31, 2012
primarily due to an increase in transactions with RBI under LAF and overseas borrowings, offset, in part,
by repayment of domestic term money borrowings. The transactions with RBI under LAF are accounted
for as borrowing and lending transactions from the quarter ended March 31, 2012, while they were
previously accounted for as purchase and sale transactions. At March 31, 2012, ` 168.00 billion has
been recorded as borrowings under LAF. The increase in overseas borrowings was on account of rupee
depreciation, bond borrowings and short-term borrowings. The borrowings of overseas branches
(including offshore banking unit) increased in USD terms by 5.7% from US$ 12.3 billion at March 31,
2011 to US$ 13.0 billion at March 31, 2012. In rupee terms, borrowings of overseas branches (including
offshore banking unit) increased by 20.2% from ` 550.48 billion at March 31, 2011 to ` 661.87 billion at
March 31, 2012. The capital-eligible borrowings, other than preference share capital, increased from
` 363.91 billion at March 31, 2011 to ` 376.15 billion at March 31, 2012.
Equity share capital and reserves
Equity share capital and reserves increased from ` 550.91 billion at March 31, 2011 to ` 604.05 billion at
March 31, 2012 primarily due to annual accretion to reserves out of profit.
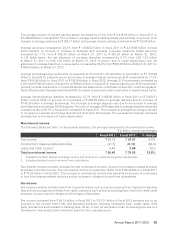
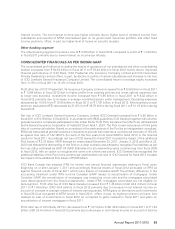
Off balance sheet items, commitments and contingencies
The following table sets forth, for the periods indicated, the principal components of contingent liabilities.
` in billion
Assets At March 31, 2011 At March 31, 2012
Claims against the Bank, not acknowledged as debts ` 17.02 ` 29.31
Liability for partly paid investments 0.13 0.13
Notional principal amount of outstanding forward exchange
contracts 2,468.62 3,560.05
Guarantees given on behalf of constituents 826.27 955.01
Acceptances, endorsements and other obligations 393.34 568.86
Notional principal amount of currency swaps 561.28 616.40
Notional principal amount of interest rate swaps and
currency options and interest rate futures 4,903.90 3,362.01
Other items for which the Bank is contingently liable 60.66 62.88
Total ` 9,231.22 ` 9,154.65
We enter into foreign exchange forwards, options, swaps and other derivative products to enable customers
to transfer, modify or reduce their foreign exchange and interest rate risk and to manage our own interest
Management’s Discussion & Analysis