ICICI Bank 2012 Annual Report Download - page 59
Download and view the complete annual report
Please find page 59 of the 2012 ICICI Bank annual report below. You can navigate through the pages in the report by either clicking on the pages listed below, or by using the keyword search tool below to find specific information within the annual report.-
 1
1 -
2
-
3
-
4
-
5
-
6
-
7
-
8
-
9
-
10
-
11
-
12
-
13
-
14
-
15
-
16
-
17
-
18
-
19
-
20
-
21
-
22
-
23
-
24
-
25
-
26
-
27
-
28
-
29
-
30
-
31
-
32
-
33
-
34
-
35
-
36
-
37
-
38
-
39
-
40
-
41
-
42
-
43
-
44
-
45
-
46
-
47
-
48
-
 49
49 -
 50
50 -
 51
51 -
 52
52 -
 53
53 -
 54
54 -
 55
55 -
 56
56 -
 57
57 -
 58
58 -
 59
59 -
 60
60 -
 61
61 -
 62
62 -
 63
63 -
 64
64 -
 65
65 -
 66
66 -
 67
67 -
 68
68 -
 69
69 -
70
-
71
-
72
-
73
-
74
-
75
-
76
-
77
-
78
-
79
-
80
-
81
-
82
-
83
-
84
-
85
-
86
-
87
-
88
-
89
-
90
-
91
-
92
-
93
-
94
-
95
-
96
-
97
-
98
-
99
-
100
-
101
-
102
-
103
-
104
-
105
-
106
-
107
-
108
-
109
-
110
-
111
-
112
-
113
-
114
-
115
-
116
-
117
-
118
-
119
-
120
-
121
-
122
-
123
-
124
-
125
-
126
-
127
-
128
-
129
-
130
-
131
-
132
-
133
-
134
-
135
-
136
-
137
-
138
-
139
-
140
-
141
-
142
-
143
-
144
-
145
-
146
-
147
-
148
-
149
-
150
-
151
-
152
-
153
-
154
-
155
-
156
-
157
-
158
-
159
-
160
-
161
-
162
-
163
-
164
-
165
-
166
-
167
-
168
-
169
-
170
-
171
-
172
-
173
-
174
-
175
-
176
-
177
-
178
-
179
-
180
-
181
-
182
-
183
-
184
-
185
-
186
-
187
-
188
-
189
-
190
-
191
-
192
-
193
-
194
-
195
-
196
-
197
-
198
-
199
-
200
-
201
-
202
-
203
-
204
-
205
-
206
-
207
-
208
-
209
-
210
-
211
-
212
 |
 |

Annual Report 2011-2012 57
Payments to and provisions for employees
Employee expenses increased by 24.8% from ` 28.17 billion in fiscal 2011 to ` 35.15 billion in fiscal 2012.
Employee expenses increased primarily due to annual increase in salaries and performance bonus and
increase in the employee base, including sales executives, employees on fixed term contracts and interns.
The average number of employees increased by around 18% in fiscal 2012 compared to fiscal 2011 (at
March 31, 2011: 56,969 employees and at March 31, 2012: 58,276 employees).
Depreciation
Depreciation on owned property decreased marginally from ` 4.84 billion in fiscal 2011 to ` 4.82 billion in
fiscal 2012. Depreciation on leased assets decreased from ` 0.79 billion in fiscal 2011 to ` 0.42 billion in fiscal
2012 primarily due to a reduction in leased assets.
Other administrative expenses
Other administrative expenses primarily include rent, taxes and lighting, advertisement and publicity, repairs
and maintenance and other expenditure. Other administrative expenses increased by 18.5% from ` 30.80
billion in fiscal 2011 to ` 36.51 billion in fiscal 2012. The increase in other administrative expenses was
primarily due to increase in our branch and ATM network. The number of branches and extension counters
(excluding foreign branches and offshore banking units) increased from 2,529 at March 31, 2011 to 2,752 at
March 31, 2012. We also increased our ATM network from 6,104 ATMs at March 31, 2011 to 9,006 ATMs at
March 31, 2012. The increase in other administrative expenses was offset, in part, by a decrease in collection
expenses and advertisement expenses.
Direct marketing agency expenses
Direct marketing agency expenses increased marginally from ` 1.57 billion in fiscal 2011 to ` 1.60 billion in
fiscal 2012. We use marketing agents, called direct marketing agents or associates, for sourcing our retail
assets. We include commissions paid to these direct marketing agents in non-interest expense. In line with
the RBI guidelines, these commissions are expensed upfront and not amortised over the life of the loan.
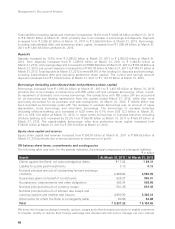
Provisions and contingencies (excluding provisions for tax)
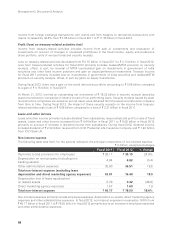
The following tables set forth, for the periods indicated, the components of provisions and contingencies.
` in billion, except percentages
Fiscal 2011 Fiscal 2012 % change
Provision for investments (including credit substitutes) (net) ` 2.04 ` 4.13 102.5%
Provision for non-performing and other assets119.77 9.93 (49.8)
Provision for standard assets — ——
Others 1.06 1.77 67.0
Total provisions and contingencies (excluding
provisions for tax) ` 22.87 ` 15.83 (30.8)%
1. Includes restructuring related provision.
Provisions are made by us on standard, sub-standard and doubtful assets at rates prescribed by RBI. Loss
assets and unsecured portions of doubtful assets are provided/written off as required by extant RBI guidelines.
Subject to the minimum provisioning levels prescribed by RBI, provisions on retail non-performing loans are
made at the borrower level in accordance with our retail assets provisioning policy. The specific provisions
on retail loans held by us are higher than the minimum regulatory requirement.
During fiscal 2012, RBI revised rates of provisioning for non-performing assets and restructured advances.
Accordingly, we made an additional provision of 5% to 10% on our non-performing advances. During fiscal
2012, RBI also revised rates of provisioning for standard restructured advances from 0.25%-1% (depending
upon the category of advance) to 2%.
Provisions and contingencies (excluding provisions for tax) decreased by 30.8% from ` 22.87 billion in fiscal
2011 to ` 15.83 billion in fiscal 2012 primarily due to a reduction in provisions for retail non-performing loans.
The reduction in provision against retail non-performing loans was primarily due to a sharp reduction in
accretion to retail non-performing loans since fiscal 2011.