ICICI Bank 2012 Annual Report Download - page 87
Download and view the complete annual report
Please find page 87 of the 2012 ICICI Bank annual report below. You can navigate through the pages in the report by either clicking on the pages listed below, or by using the keyword search tool below to find specific information within the annual report.-
 1
1 -
2
-
3
-
4
-
5
-
6
-
7
-
8
-
9
-
10
-
11
-
12
-
13
-
14
-
15
-
16
-
17
-
18
-
19
-
20
-
21
-
22
-
23
-
24
-
25
-
26
-
27
-
28
-
29
-
30
-
31
-
32
-
33
-
34
-
35
-
36
-
37
-
38
-
39
-
40
-
41
-
42
-
43
-
44
-
45
-
46
-
47
-
48
-
49
-
50
-
51
-
52
-
53
-
54
-
55
-
56
-
57
-
58
-
59
-
60
-
61
-
62
-
63
-
64
-
65
-
66
-
67
-
68
-
69
-
70
-
71
-
72
-
73
-
74
-
75
-
76
-
 77
77 -
 78
78 -
 79
79 -
 80
80 -
 81
81 -
 82
82 -
 83
83 -
 84
84 -
 85
85 -
 86
86 -
 87
87 -
 88
88 -
 89
89 -
 90
90 -
 91
91 -
 92
92 -
 93
93 -
 94
94 -
 95
95 -
 96
96 -
 97
97 -
98
-
99
-
100
-
101
-
102
-
103
-
104
-
105
-
106
-
107
-
108
-
109
-
110
-
111
-
112
-
113
-
114
-
115
-
116
-
117
-
118
-
119
-
120
-
121
-
122
-
123
-
124
-
125
-
126
-
127
-
128
-
129
-
130
-
131
-
132
-
133
-
134
-
135
-
136
-
137
-
138
-
139
-
140
-
141
-
142
-
143
-
144
-
145
-
146
-
147
-
148
-
149
-
150
-
151
-
152
-
153
-
154
-
155
-
156
-
157
-
158
-
159
-
160
-
161
-
162
-
163
-
164
-
165
-
166
-
167
-
168
-
169
-
170
-
171
-
172
-
173
-
174
-
175
-
176
-
177
-
178
-
179
-
180
-
181
-
182
-
183
-
184
-
185
-
186
-
187
-
188
-
189
-
190
-
191
-
192
-
193
-
194
-
195
-
196
-
197
-
198
-
199
-
200
-
201
-
202
-
203
-
204
-
205
-
206
-
207
-
208
-
209
-
210
-
211
-
212
 |
 |

F9
At
31.03.2012
At
31.03.2011
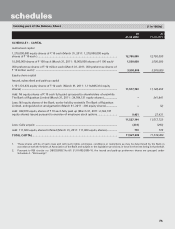
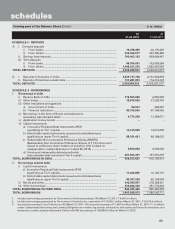
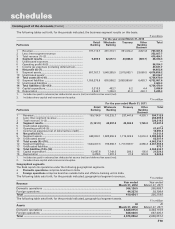
SCHEDULE 8 - INVESTMENTS
I. Investments in India [net of provisions]
i) Government securities ........................................................................................ 869,480,205 641,287,140
ii) Other approved securities ................................................................................... 4,250 325,363
iii) Shares (includes equity and preference shares) ............................................... 22,922,636 28,134,073
iv) Debentures and bonds ....................................................................................... 195,135,236 161,462,866
v) Subsidiaries and/or joint ventures1 ..................................................................... 64,796,927 64,796,927
vi) Others (commercial paper, mutual fund units, pass through certificates,
security receipts, certificate of deposits, RIDF and other related
investments etc.) ............................................................................................... 361,872,334 356,934,417
TOTAL INVESTMENTS IN INDIA ...................................................................................... 1,514,211,588 1,252,940,786
II. Investments outside India [net of provisions]
i) Government securities ........................................................................................ 4,399,569 8,862,278
ii) Subsidiaries and/or joint ventures abroad
(includes equity and preference shares) ............................................................ 66,864,257 66,026,356
iii) Others ................................................................................................................... 10,125,016 19,030,210
TOTAL INVESTMENTS OUTSIDE INDIA .......................................................................... 81,388,842 93,918,844
TOTAL INVESTMENTS ...................................................................................................... 1,595,600,430 1,346,859,630
A. Investments in India
Gross value of investments ....................................................................................... 1,539,777,243 1,272,423,922
Less: Aggregate of provision/depreciation ............................................................... 25,565,655 19,483,136
Net investments.......................................................................................................... 1,514,211,588 1,252,940,786
B. Investments outside India
Gross value of investments ....................................................................................... 81,826,347 94,499,793
Less: Aggregate of provision/depreciation ............................................................... 437,505 580,949
Net investments.......................................................................................................... 81,388,842 93,918,844
TOTAL INVESTMENTS ...................................................................................................... 1,595,600,430 1,346,859,630
1. Includes application money amounting to ` 50.7 million (March 31, 2011: ` 50.7 million).
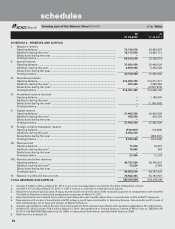
SCHEDULE 9 - ADVANCES [net of provisions]
A. i) Bills purchased and discounted .......................................................................... 48,693,815 58,480,555
ii) Cash credits, overdrafts and loans repayable on demand ................................ 317,745,152 302,123,773
iii) Term loans ............................................................................................................ 2,019,802,749 1,690,225,268
iv) Securitisation, finance lease and hire purchase receivables ............................ 151,034,863 112,829,418
TOTAL ADVANCES ............................................................................................................ 2,537,276,579 2,163,659,014
B. i) Secured by tangible assets (includes advances against book debts) ............... 2,138,141,465 1,679,661,354
ii) Covered by bank/government guarantees ......................................................... 13,869,020 27,057,409
iii) Unsecured ............................................................................................................ 385,266,094 456,940,251
TOTAL ADVANCES ............................................................................................................ 2,537,276,579 2,163,659,014
C. I. Advances in India
i) Priority sector ................................................................................................ 592,856,433 534,015,609
ii) Public sector .................................................................................................. 11,968,345 13,788,639
iii) Banks ............................................................................................................. 154,618 1,810,607
iv) Others ............................................................................................................ 1,238,268,015 1,063,077,445
TOTAL ADVANCES IN INDIA ............................................................................................ 1,843,247,411 1,612,692,300
II. Advances outside India
i) Due from banks ............................................................................................ 22,280,480 37,410,346
ii) Due from others
a) Bills purchased and discounted ............................................................. 5,098,400 4,572,713
b) Syndicated and term loans ..................................................................... 647,151,172 494,699,999
c) Others ...................................................................................................... 19,499,116 14,283,656
TOTAL ADVANCES OUTSIDE INDIA ................................................................................ 694,029,168 550,966,714
TOTAL ADVANCES ............................................................................................................ 2,537,276,579 2,163,659,014
(` in ‘000s)
forming part of the Balance Sheet (Contd.)
schedules