ICICI Bank 2012 Annual Report Download - page 53
Download and view the complete annual report
Please find page 53 of the 2012 ICICI Bank annual report below. You can navigate through the pages in the report by either clicking on the pages listed below, or by using the keyword search tool below to find specific information within the annual report.-
 1
1 -
2
-
3
-
4
-
5
-
6
-
7
-
8
-
9
-
10
-
11
-
12
-
13
-
14
-
15
-
16
-
17
-
18
-
19
-
20
-
21
-
22
-
23
-
24
-
25
-
26
-
27
-
28
-
29
-
30
-
31
-
32
-
33
-
34
-
35
-
36
-
37
-
38
-
39
-
40
-
41
-
42
-
 43
43 -
 44
44 -
 45
45 -
 46
46 -
 47
47 -
 48
48 -
 49
49 -
 50
50 -
 51
51 -
 52
52 -
 53
53 -
 54
54 -
 55
55 -
 56
56 -
 57
57 -
 58
58 -
 59
59 -
 60
60 -
 61
61 -
 62
62 -
 63
63 -
64
-
65
-
66
-
67
-
68
-
69
-
70
-
71
-
72
-
73
-
74
-
75
-
76
-
77
-
78
-
79
-
80
-
81
-
82
-
83
-
84
-
85
-
86
-
87
-
88
-
89
-
90
-
91
-
92
-
93
-
94
-
95
-
96
-
97
-
98
-
99
-
100
-
101
-
102
-
103
-
104
-
105
-
106
-
107
-
108
-
109
-
110
-
111
-
112
-
113
-
114
-
115
-
116
-
117
-
118
-
119
-
120
-
121
-
122
-
123
-
124
-
125
-
126
-
127
-
128
-
129
-
130
-
131
-
132
-
133
-
134
-
135
-
136
-
137
-
138
-
139
-
140
-
141
-
142
-
143
-
144
-
145
-
146
-
147
-
148
-
149
-
150
-
151
-
152
-
153
-
154
-
155
-
156
-
157
-
158
-
159
-
160
-
161
-
162
-
163
-
164
-
165
-
166
-
167
-
168
-
169
-
170
-
171
-
172
-
173
-
174
-
175
-
176
-
177
-
178
-
179
-
180
-
181
-
182
-
183
-
184
-
185
-
186
-
187
-
188
-
189
-
190
-
191
-
192
-
193
-
194
-
195
-
196
-
197
-
198
-
199
-
200
-
201
-
202
-
203
-
204
-
205
-
206
-
207
-
208
-
209
-
210
-
211
-
212
 |
 |
Annual Report 2011-2012 51
status to MFIs by allowing a new category of NBFC-MFIs having a minimum networth of ` 50.0 million,
a minimum capital adequacy ratio of 15.0% of risk weighted assets and with interest on individual loans
capped at 25.0% per annum with an aggregate margin cap of 12.0%. Also, MFIs were allowed to raise
external commercial borrowings of up to US$ 10 million.
In February 2012, RBI released a draft report of the committee set up to review the extant classification
and guidelines pertaining to priority sector lending. The committee has recommended maintaining the
priority sector lending target of 40% of adjusted net bank credit. It has recommended that the distinction
between direct and indirect agriculture lending be removed, while maintaining the overall target for
agriculture lending at 18% of adjusted net bank credit and having a new sub-target of 9% for loans to
small and marginal farmers and 7% for loans to micro and small enterprises. The committee has also
recommended that deposits deployed against shortfall in achievement of priority sector lending targets
be netted from the actual penalty for the subsequent years for non-achievement of targets.
In March 2012, RBI released a discussion paper on dynamic loan loss provisioning framework, which
proposes to replace the existing general provisioning norms. The objective is to limit the volatility in loan
loss provisioning requirements witnessed during an economic cycle.
STANDALONE FINANCIALS AS PER INDIAN GAAP
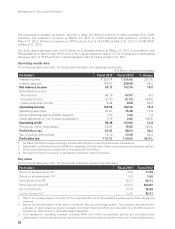
Summary
During fiscal 2012, we focused on profitable growth by leveraging our rebalanced funding mix and strong
capital position to grow our loan portfolio and improving the credit quality of our loan portfolio.
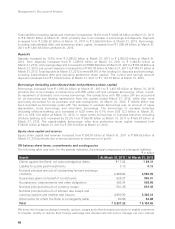
Our profit after tax increased by 25.5% from ` 51.51 billion in fiscal 2011 to ` 64.65 billion in fiscal 2012.
The increase in profit after tax was mainly due to a 19.0% increase in net interest income, 12.8% increase
in non-interest income and 30.8% decrease in provisions and contingencies (excluding provisions for tax).
Net interest income increased by 19.0% from ` 90.17 billion in fiscal 2011 to ` 107.34 billion in fiscal 2012,
reflecting an increase of 9 basis points in net interest margin and an increase of 15.0% in average interest-
earning assets.
Non-interest income increased by 12.8% from ` 66.48 billion in fiscal 2011 to ` 75.02 billion in fiscal
2012. The increase in non-interest income was primarily due to an increase in dividend income
from subsidiaries from ` 4.11 billion in fiscal 2011 to ` 7.36 billion in fiscal 2012 and a decrease in
loss from treasury-related activities from ` 2.15 billion in fiscal 2011 to ` 0.13 billion in fiscal 2012.
Loss from treasury-related activities for fiscal 2012 primarily includes realised/MTM provision on security
receipts, offset, in part, by reversal of MTM loss/realised gain on investments in government of India securities
and other fixed income positions and gain on equity/preference investments. Fee income increased by 4.5% from
` 64.19 billion in fiscal 2011 to ` 67.07 billion in fiscal 2012.
Non-interest expenses increased by 18.6% from ` 66.17 billion in fiscal 2011 to ` 78.50 billion in fiscal
2012 primarily due to an increase in employee expenses and other administrative expenses. Provisions
and contingencies (excluding provisions for tax) decreased by 30.8% from ` 22.87 billion in fiscal 2011 to
` 15.83 billion in fiscal 2012. The decrease in provisions and contingencies (excluding provisions for tax) was
primarily due to a reduction in provisions for retail non-performing loans, as accretion to retail non-performing
loans declined sharply from fiscal 2011.
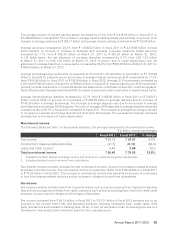
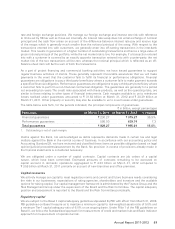
Total assets increased by 16.6% from ` 4,062.34 billion at March 31, 2011 to ` 4,736.47 billion at
March 31, 2012. Total deposits increased by 13.3% from ` 2,256.02 billion at March 31, 2011 to
` 2,555.00 billion at March 31, 2012. Savings account deposits increased by 13.7% from ` 668.69 billion at
March 31, 2011 to ` 760.46 billion at March 31, 2012. Current and savings account (CASA) deposits ratio was
43.5% at March 31, 2012 compared to 45.1% at March 31, 2011. Term deposits increased by 16.6% from
` 1,239.55 billion at March 31, 2011 to ` 1,444.81 billion at March 31, 2012. Total advances increased by 17.3%
from ` 2,163.66 billion at March 31, 2011 to ` 2,537.28 billion at March 31, 2012 primarily due to an increase
in domestic and overseas corporate loans and an increase in the retail loan book. Net non-performing assets
decreased by 22.9% from ` 24.58 billion at March 31, 2011 to ` 18.94 billion at March 31, 2012 and the net
non-performing asset ratio decreased from 0.94% at March 31, 2011 to 0.62% at March 31, 2012.