ICICI Bank 2012 Annual Report Download - page 156
Download and view the complete annual report
Please find page 156 of the 2012 ICICI Bank annual report below. You can navigate through the pages in the report by either clicking on the pages listed below, or by using the keyword search tool below to find specific information within the annual report.-
 1
1 -
2
-
3
-
4
-
5
-
6
-
7
-
8
-
9
-
10
-
11
-
12
-
13
-
14
-
15
-
16
-
17
-
18
-
19
-
20
-
21
-
22
-
23
-
24
-
25
-
26
-
27
-
28
-
29
-
30
-
31
-
32
-
33
-
34
-
35
-
36
-
37
-
38
-
39
-
40
-
41
-
42
-
43
-
44
-
45
-
46
-
47
-
48
-
49
-
50
-
51
-
52
-
53
-
54
-
55
-
56
-
57
-
58
-
59
-
60
-
61
-
62
-
63
-
64
-
65
-
66
-
67
-
68
-
69
-
70
-
71
-
72
-
73
-
74
-
75
-
76
-
77
-
78
-
79
-
80
-
81
-
82
-
83
-
84
-
85
-
86
-
87
-
88
-
89
-
90
-
91
-
92
-
93
-
94
-
95
-
96
-
97
-
98
-
99
-
100
-
101
-
102
-
103
-
104
-
105
-
106
-
107
-
108
-
109
-
110
-
111
-
112
-
113
-
114
-
115
-
116
-
117
-
118
-
119
-
120
-
121
-
122
-
123
-
124
-
125
-
126
-
127
-
128
-
129
-
130
-
131
-
132
-
133
-
134
-
135
-
136
-
137
-
138
-
139
-
140
-
141
-
142
-
143
-
144
-
145
-
 146
146 -
 147
147 -
 148
148 -
 149
149 -
 150
150 -
 151
151 -
 152
152 -
 153
153 -
 154
154 -
 155
155 -
 156
156 -
 157
157 -
 158
158 -
 159
159 -
 160
160 -
 161
161 -
 162
162 -
 163
163 -
 164
164 -
 165
165 -
 166
166 -
167
-
168
-
169
-
170
-
171
-
172
-
173
-
174
-
175
-
176
-
177
-
178
-
179
-
180
-
181
-
182
-
183
-
184
-
185
-
186
-
187
-
188
-
189
-
190
-
191
-
192
-
193
-
194
-
195
-
196
-
197
-
198
-
199
-
200
-
201
-
202
-
203
-
204
-
205
-
206
-
207
-
208
-
209
-
210
-
211
-
212
 |
 |

F78
forming part of the Consolidated Accounts (Contd.)
schedules
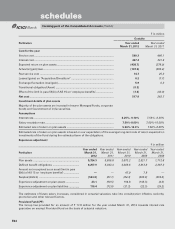
If ICICI Bank had used the fair value of options based on binomial tree model, compensation cost in the year ended
March 31, 2012 would have been higher by ` 1,816.1 million. The key assumptions used to estimate the fair value of
options granted during the year ended March 31, 2012 are given below.
Risk-free interest rate .......................................................................................................................... 7.99-9.07% p.a.
Expected life ........................................................................................................................................ 6.35-6.98 years
Expected volatility ............................................................................................................................... 47.53-49.20% p.a.
Expected dividend yield ..................................................................................................................... 1.26-1.60% p.a.
The weighted average fair value of options granted during the year ended March 31, 2012 is ` 592.52 per option
(March 31, 2011: ` 535.87).
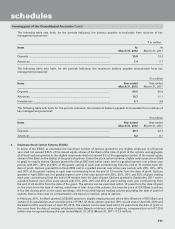
A summary of the status of the Bank’s stock option plan is given below.
` except number of options
Stock options outstanding
Year ended March 31, 2012 Year ended March 31, 2011
Particulars
Number of
options
Weighted
Average
Exercise Price
Number of
options
Weighted
Average
Exercise Price
Outstanding at the beginning of the year ....................... 20,529,387 779.72 18,763,460 689.50
Add: Granted during the year ......................................... 4,060,600 1,104.82 5,514,600 972.00
Less: Lapsed during the year, net of re-issuance .......... 448,372 798.77 1,005,536 871.95
Less: Exercised during the year ...................................... 942,070 510.94 2,743,137 517.21
Outstanding at the end of the year ................................. 23,199,545 846.94 20,529,387 779.72
Options exercisable ......................................................... 12,019,655 745.26 10,197,137 682.72
In terms of the Scheme, 23,199,545 options (March 31, 2011: 20,529,387 options) granted to eligible employees were
outstanding at March 31, 2012.
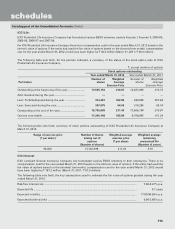
A summary of stock options outstanding at March 31, 2012 is given below.
Range of exercise price
(` per share)
Number of shares
arising out of
options
Weighted average
exercise price
(` per share)
Weighted average
remaining
contractual life
(Number of years)
105-299 28,925 132.05 1.07
300-599 6,048,620 471.10 4.35
600-999 13,122,000 942.79 6.80
1,000-1,399 4,000,000 1,106.03 9.04
A summary of stock options outstanding at March 31, 2011 is given below.
Range of exercise price
(` per share)
Number of shares
arising out of
options
Weighted average
exercise price
(` per share)
Weighted average
remaining
contractual life
(Number of years)
105-299 95,086 137.13 1.07
300-599 6,906,951 466.85 5.30
600-999 13,426,350 942.54 7.78
1,000-1,399 101,000 1,084.59 7.94
The options were exercised regularly throughout the period and weighted average share price as per NSE price volume
data during the year ended March 31, 2012 was ` 922.76 (March 31, 2011: ` 1,014.96).