ICICI Bank 2012 Annual Report Download - page 51
Download and view the complete annual report
Please find page 51 of the 2012 ICICI Bank annual report below. You can navigate through the pages in the report by either clicking on the pages listed below, or by using the keyword search tool below to find specific information within the annual report.
Annual Report 2011-2012 49
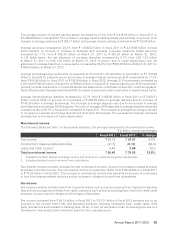
to 8.57% at March 30, 2012 from 7.99% at March 31, 2011. In response to tight liquidity conditions and
a rising interest rate environment, scheduled commercial banks increased their deposit and lending rates
particularly in the first half of fiscal 2012. In April 2012, systemic liquidity conditions have improved with the
deficit reducing to around ` 900.00 billion at April 23, 2012. Several banks have reduced their lending and
deposit rates following the monetary policy announcement.
Non-food credit growth moderated during the year, from 21.3% at March 25, 2011 to 16.8% at March 23,
2012, before picking up towards the end of the year. Non-food credit growth at March 30, 2012 was 19.3%.
Based on sector-wise data available till February 2012, growth in credit to industry was 19.1% and to the
services sector was 15.2% on a year-on-year basis. Credit to the infrastructure sector moderated significantly
recording a growth of 18.7% year-on-year at February 24, 2012 compared to 39.7% at February 25, 2011
mainly due to a slowdown in credit to the power and telecommunication sectors. Retail loan growth also
slowed down to 11.4% year-on-year at February 24, 2012 compared to 16.2% at February 25, 2011. Similarly,
deposit growth moderated during the year from 15.9% at March 25, 2011 to 13.4% at March 23, 2012, driven
mainly by the decline in demand deposit growth from a reduction of 0.6% at March 25, 2011 to a reduction
of 2.9% at March 23, 2012. Deposit growth picked up at the year-end, with year-on-year growth in demand
deposits at 15.3% and term deposits at 17.7% at March 30, 2012.
The Union Budget for fiscal 2013 has projected the government’s fiscal deficit to come down from an
estimated 5.9% of GDP in fiscal 2012 to 5.1% in fiscal 2013. RBI has projected India’s GDP to grow by
7.3% in fiscal 2013, with credit growth estimated at 17.0% and deposit growth at 16.0%. RBI has projected
inflation to be at 6.5% in March 2013.
Equity markets remained volatile during fiscal 2012 due to global and domestic events. The Eurozone
sovereign debt crisis and sovereign rating downgrades by rating agencies along with the global economic
slowdown impacted investor sentiment, particularly in the second and third quarter of fiscal 2012. On an
overall basis, the benchmark equity index, the BSE Sensex, declined by 10.4% from 19,445 at March 31,
2011 to 17,404 at March 31, 2012. Foreign institutional investment flows into India during fiscal 2012 were
significantly lower compared to fiscal 2011, with net inflows of around USD 2.74 billion during the first nine
months of fiscal 2012 compared to USD 29.46 billion in the corresponding period of fiscal 2011. In addition,
a steeper slowdown in exports compared to imports during the year, contributed to a deficit of USD 7.09
billion in India’s balance of payments during the first nine months of fiscal 2012 as compared to a surplus of
USD 11.02 billion during the corresponding period of fiscal 2011. The rupee depreciated by 14.6% against
the US dollar from ` 44.65 per US dollar at March 31, 2011 to ` 51.16 per US dollar at March 31, 2012.
First year retail premium underwritten in the life insurance sector decreased by 4.8% (on weighted received
premium basis) to ` 479.41 billion in fiscal 2012 from ` 503.68 billion in fiscal 2011. The average assets under
management of mutual funds decreased by 5.1% to ` 6,647.92 billion in March 2012 from ` 7,005.38 billion
in March 2011. Gross premium of the non-life insurance sector (excluding specialised insurance institutions)
grew by 23.0% to ` 547.62 billion in fiscal 2012 from ` 445.34 billion in fiscal 2011.
Some key regulatory developments in the Indian financial sector during fiscal 2012 include:
In May 2011, RBI increased the interest rate on savings deposits by 50 basis points from 3.5% to 4.0%.
Further, in October 2011, interest rates on savings accounts were deregulated with a uniform interest
rate to be paid on deposits up to ` 100,000 and differential rates permitted for deposits of over ` 100,000
depending on the amount.
RBI enhanced the rates of provisioning for non-performing loans in May 2011. Accordingly, the provision
for restructured non-performing advances when upgraded to standard assets was increased to 2.0% in


