ICICI Bank 2012 Annual Report Download - page 100
Download and view the complete annual report
Please find page 100 of the 2012 ICICI Bank annual report below. You can navigate through the pages in the report by either clicking on the pages listed below, or by using the keyword search tool below to find specific information within the annual report.-
 1
1 -
2
-
3
-
4
-
5
-
6
-
7
-
8
-
9
-
10
-
11
-
12
-
13
-
14
-
15
-
16
-
17
-
18
-
19
-
20
-
21
-
22
-
23
-
24
-
25
-
26
-
27
-
28
-
29
-
30
-
31
-
32
-
33
-
34
-
35
-
36
-
37
-
38
-
39
-
40
-
41
-
42
-
43
-
44
-
45
-
46
-
47
-
48
-
49
-
50
-
51
-
52
-
53
-
54
-
55
-
56
-
57
-
58
-
59
-
60
-
61
-
62
-
63
-
64
-
65
-
66
-
67
-
68
-
69
-
70
-
71
-
72
-
73
-
74
-
75
-
76
-
77
-
78
-
79
-
80
-
81
-
82
-
83
-
84
-
85
-
86
-
87
-
88
-
89
-
 90
90 -
 91
91 -
 92
92 -
 93
93 -
 94
94 -
 95
95 -
 96
96 -
 97
97 -
 98
98 -
 99
99 -
 100
100 -
 101
101 -
 102
102 -
 103
103 -
 104
104 -
 105
105 -
 106
106 -
 107
107 -
 108
108 -
 109
109 -
 110
110 -
111
-
112
-
113
-
114
-
115
-
116
-
117
-
118
-
119
-
120
-
121
-
122
-
123
-
124
-
125
-
126
-
127
-
128
-
129
-
130
-
131
-
132
-
133
-
134
-
135
-
136
-
137
-
138
-
139
-
140
-
141
-
142
-
143
-
144
-
145
-
146
-
147
-
148
-
149
-
150
-
151
-
152
-
153
-
154
-
155
-
156
-
157
-
158
-
159
-
160
-
161
-
162
-
163
-
164
-
165
-
166
-
167
-
168
-
169
-
170
-
171
-
172
-
173
-
174
-
175
-
176
-
177
-
178
-
179
-
180
-
181
-
182
-
183
-
184
-
185
-
186
-
187
-
188
-
189
-
190
-
191
-
192
-
193
-
194
-
195
-
196
-
197
-
198
-
199
-
200
-
201
-
202
-
203
-
204
-
205
-
206
-
207
-
208
-
209
-
210
-
211
-
212
 |
 |

F22
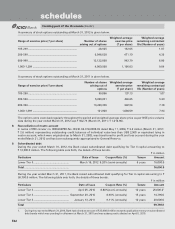
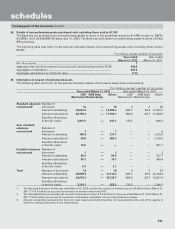
A summary of stock options outstanding at March 31, 2012 is given below.
Range of exercise price (` per share)
Number of shares
arising out of options
Weighted average
exercise price
(` per share)
Weighted average
remaining contractual
life (Number of years)
105-299 .................................................................. 28,925 132.05 1.07
300-599 .................................................................. 6,048,620 471.10 4.35
600-999 .................................................................. 13,122,000 942.79 6.80
1,000-1,399 ............................................................ 4,000,000 1,106.03 9.04
A summary of stock options outstanding at March 31, 2011 is given below.
Range of exercise price (` per share)
Number of shares
arising out of
options
Weighted average
exercise price
(` per share)
Weighted average
remaining contractual
life (Number of years)
105-299 .................................................................. 95,086 137.13 1.07
300-599 .................................................................. 6,906,951 466.85 5.30
600-999 .................................................................. 13,426,350 942.54 7.78
1,000-1,399 ............................................................ 101,000 1,084.59 7.94
The options were exercised regularly throughout the period and weighted average share price as per NSE price volume
data during the year ended March 31, 2012 was ` 922.76 (March 31, 2011: ` 1,014.96).
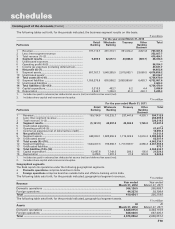
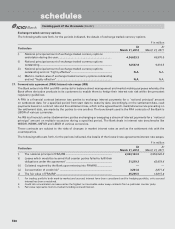
8. Reconciliation of nostro account
In terms of RBI circular no. DBOD.BP.BC.No.133/21.04.018/2008-09 dated May 11, 2009, ` 3.2 million (March 31, 2011:
` 2.6 million) representing outstanding credit balances of individual value less than US$ 2,500 or equivalent lying in
nostro account, which were originated up to March 31, 2002, was transferred to profit and loss account during the year
ended March 31, 2012 and has been subsequently appropriated to General Reserve.
9. Subordinated debt
During the year ended March 31, 2012, the Bank raised subordinated debt qualifying for Tier II capital amounting to
` 16,000.0 million. The following table sets forth, the details of these bonds.
` in million
Particulars Date of Issue Coupon Rate (%) Tenure Amount
Lower Tier II ................................................ March 16, 2012 9.20% (semi-annually) 6 years 16,000.0
Total ............................................................ 16,000.0
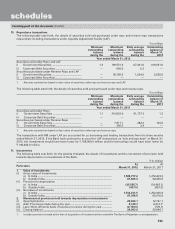
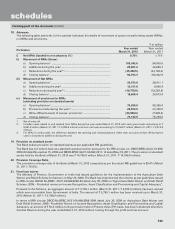
During the year ended March 31, 2011, the Bank raised subordinated debt qualifying for Tier II capital amounting to `
59,790.0 million. The following table sets forth, the details of these bonds.
` in million
Particulars Date of Issue Coupon Rate (%) Tenure Amount
Lower Tier II ................................................ April 05, 2010 8.88%(semi-annually) 10 years 25,000.01
Lower Tier II ................................................ September 29, 2010 8.90% (annually) 15 years 14,790.0
Lower Tier II ................................................ January 13, 2011 9.11% (annually) 10 years 20,000.0
Total 59,790.0
1. During the year ended March 31, 2010, Bank had raised an amount of ` 25,000.0 million towards application money on subordinated
debt bonds which was pending for allotment at March 31, 2010 and was subsequently allotted on April 5, 2010.
forming part of the Accounts (Contd.)
schedules