ICICI Bank 2012 Annual Report Download - page 109
Download and view the complete annual report
Please find page 109 of the 2012 ICICI Bank annual report below. You can navigate through the pages in the report by either clicking on the pages listed below, or by using the keyword search tool below to find specific information within the annual report.-
 1
1 -
2
-
3
-
4
-
5
-
6
-
7
-
8
-
9
-
10
-
11
-
12
-
13
-
14
-
15
-
16
-
17
-
18
-
19
-
20
-
21
-
22
-
23
-
24
-
25
-
26
-
27
-
28
-
29
-
30
-
31
-
32
-
33
-
34
-
35
-
36
-
37
-
38
-
39
-
40
-
41
-
42
-
43
-
44
-
45
-
46
-
47
-
48
-
49
-
50
-
51
-
52
-
53
-
54
-
55
-
56
-
57
-
58
-
59
-
60
-
61
-
62
-
63
-
64
-
65
-
66
-
67
-
68
-
69
-
70
-
71
-
72
-
73
-
74
-
75
-
76
-
77
-
78
-
79
-
80
-
81
-
82
-
83
-
84
-
85
-
86
-
87
-
88
-
89
-
90
-
91
-
92
-
93
-
94
-
95
-
96
-
97
-
98
-
 99
99 -
 100
100 -
 101
101 -
 102
102 -
 103
103 -
 104
104 -
 105
105 -
 106
106 -
 107
107 -
 108
108 -
 109
109 -
 110
110 -
 111
111 -
 112
112 -
 113
113 -
 114
114 -
 115
115 -
 116
116 -
 117
117 -
 118
118 -
 119
119 -
120
-
121
-
122
-
123
-
124
-
125
-
126
-
127
-
128
-
129
-
130
-
131
-
132
-
133
-
134
-
135
-
136
-
137
-
138
-
139
-
140
-
141
-
142
-
143
-
144
-
145
-
146
-
147
-
148
-
149
-
150
-
151
-
152
-
153
-
154
-
155
-
156
-
157
-
158
-
159
-
160
-
161
-
162
-
163
-
164
-
165
-
166
-
167
-
168
-
169
-
170
-
171
-
172
-
173
-
174
-
175
-
176
-
177
-
178
-
179
-
180
-
181
-
182
-
183
-
184
-
185
-
186
-
187
-
188
-
189
-
190
-
191
-
192
-
193
-
194
-
195
-
196
-
197
-
198
-
199
-
200
-
201
-
202
-
203
-
204
-
205
-
206
-
207
-
208
-
209
-
210
-
211
-
212
 |
 |

F31
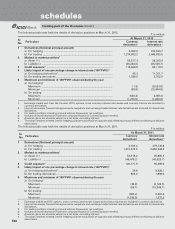
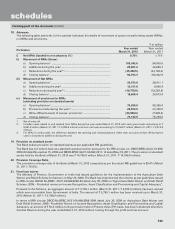
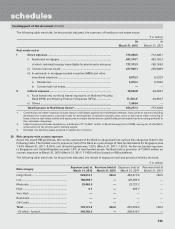
24. Details of non-performing assets purchased/sold, excluding those sold to SC/RC
The Bank has not purchased any non-performing assets in terms of the guidelines issued by the RBI circular no. DBOD.
No.BP.BC.16/21.04.048/2005-06 dated July 13, 2005. The Bank has sold certain non-performing assets in terms of these
RBI guidelines.
The following table sets forth, for the periods indicated, details of non-performing assets sold, excluding those sold to
SC/RC.
` in million, except number of accounts
Year ended
March 31, 2012
Year ended
March 31, 2011
No. of accounts ..................................................................................................................... 1..
Aggregate value (net of provisions) of accounts sold, excluding those sold to SC/RC
642.0 ..
Aggregate consideration .................................................................................................... 641.0 ..
Aggregate gain/(loss) over net book value .................................................................. (1.0) ..
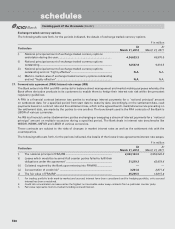
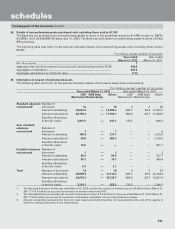
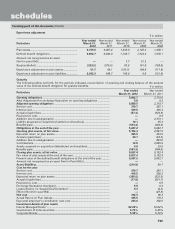
25. Information in respect of restructured assets
The following table sets forth, for the periods indicated, details of loan assets subjected to restructuring.
` in million, except number of accounts
Year ended March 31, 2012 Year ended March 31, 2011
CDR
Mechanism
SME Debt
Restructuring
Others CDR
Mechanism
SME Debt
Restructuring
Others
Standard advances
restructured3
Number of
borrowers 12 — 16 4260
Amount outstanding 24,667.5 — 12,688.3 993.7 99.4 11,627.7
Amount restructured 24,159.4 — 11,790.1 964.6 89.7 11,024.6
Sacrifice (diminution
in the fair value) 3,297.5 — 447.1 132.5 — 645.2
Sub- standard
advances
restructured
Number of
borrowers 1—1——5
Amount outstanding 155.8 — 337.1 — — 1,215.2
Amount restructured 69.8 — 269.5 — — 1,216.6
Sacrifice (diminution
in the fair value) 15.5 — — — — 651.1
Doubtful advances
restructured
Number of
borrowers 1—1——2
Amount outstanding 85.6 — 86.9 — — 321.7
Amount restructured 50.1 — 79.1 — — 360.4
Sacrifice (diminution
in the fair value) 6.1 — 3.1 ———
Total Number of borrowers 14 — 18 4267
Amount outstanding 24,908.9 — 13,112.3 993.7 99.4 13,164.6
Amount restructured 24,279.3 — 12,138.7 964.6 89.7 12,601.6
Sacrifice (diminution
in the fair value) 3,319.1 — 450.2 132.5 — 1,296.3
1. The aforesaid disclosure for the year ended March 31, 2012 includes the reversal of interest income of ` 868.8 million (March 31,
2011: ` 176.7 million) on account of conversion of overdue interest into FITL.
2. The aforesaid disclosure excludes the reversal of derivative income of ` 9.9 million for the year ended March 31, 2012 (March 31,
2011: ` 18.5 million) on account of conversion of derivative receivables into term loan/preference shares.
3. Amount outstanding represents the borrower level balances (including facilities not restructured) at the end of the quarter in
which the restructuring scheme was implemented.
forming part of the Accounts (Contd.)
schedules