ICICI Bank 2012 Annual Report Download - page 174
Download and view the complete annual report
Please find page 174 of the 2012 ICICI Bank annual report below. You can navigate through the pages in the report by either clicking on the pages listed below, or by using the keyword search tool below to find specific information within the annual report.-
 1
1 -
2
-
3
-
4
-
5
-
6
-
7
-
8
-
9
-
10
-
11
-
12
-
13
-
14
-
15
-
16
-
17
-
18
-
19
-
20
-
21
-
22
-
23
-
24
-
25
-
26
-
27
-
28
-
29
-
30
-
31
-
32
-
33
-
34
-
35
-
36
-
37
-
38
-
39
-
40
-
41
-
42
-
43
-
44
-
45
-
46
-
47
-
48
-
49
-
50
-
51
-
52
-
53
-
54
-
55
-
56
-
57
-
58
-
59
-
60
-
61
-
62
-
63
-
64
-
65
-
66
-
67
-
68
-
69
-
70
-
71
-
72
-
73
-
74
-
75
-
76
-
77
-
78
-
79
-
80
-
81
-
82
-
83
-
84
-
85
-
86
-
87
-
88
-
89
-
90
-
91
-
92
-
93
-
94
-
95
-
96
-
97
-
98
-
99
-
100
-
101
-
102
-
103
-
104
-
105
-
106
-
107
-
108
-
109
-
110
-
111
-
112
-
113
-
114
-
115
-
116
-
117
-
118
-
119
-
120
-
121
-
122
-
123
-
124
-
125
-
126
-
127
-
128
-
129
-
130
-
131
-
132
-
133
-
134
-
135
-
136
-
137
-
138
-
139
-
140
-
141
-
142
-
143
-
144
-
145
-
146
-
147
-
148
-
149
-
150
-
151
-
152
-
153
-
154
-
155
-
156
-
157
-
158
-
159
-
160
-
161
-
162
-
163
-
 164
164 -
 165
165 -
 166
166 -
 167
167 -
 168
168 -
 169
169 -
 170
170 -
 171
171 -
 172
172 -
 173
173 -
 174
174 -
 175
175 -
 176
176 -
 177
177 -
 178
178 -
 179
179 -
 180
180 -
 181
181 -
 182
182 -
 183
183 -
 184
184 -
185
-
186
-
187
-
188
-
189
-
190
-
191
-
192
-
193
-
194
-
195
-
196
-
197
-
198
-
199
-
200
-
201
-
202
-
203
-
204
-
205
-
206
-
207
-
208
-
209
-
210
-
211
-
212
 |
 |

F96
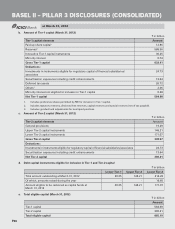
b. Amount of Tier-1 capital (March 31, 2012)
` in billion
Tier-1 capital elements Amount
Paid-up share capital1 12.86
Reserves2 588.56
Innovative Tier-1 capital instruments 30.25
Minority interest 0.74
Gross Tier-1 capital 632.41
Deductions:
Investments in instruments eligible for regulatory capital of financial subsidiaries/
associates
24.73
Securitisation exposures including credit enhancements 13.64
Deferred tax assets 26.72
Others3 2.06
Minority interest not eligible for inclusion in Tier-1 capital 0.28
Net Tier-1 capital 564.98
1. Includes preference shares permitted by RBI for inclusion in Tier-1 capital.
2. Includes statutory reserves, disclosed free reserves, capital reserves and special reserves (net of tax payable).
3. Includes goodwill and adjustments for less liquid positions.
c. Amount of Tier-2 capital (March 31, 2012)
` in billion
Tier-2 capital elements Amount
General provisions 19.29
Upper Tier-2 capital instruments 148.21
Lower Tier-2 capital instruments 171.07
Gross Tier-2 capital 338.57
Deductions:
Investments in instruments eligible for regulatory capital of financial subsidiaries/associates 24.73
Securitisation exposures including credit enhancements 13.64
Net Tier-2 capital 300.21
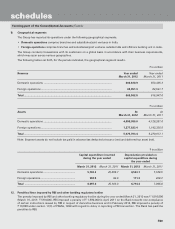
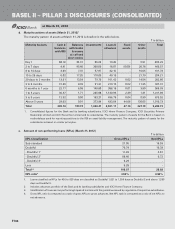
d. Debt capital instruments eligible for inclusion in Tier-1 and Tier-2 capital
` in billion
Lower Tier-1 Upper Tier-2 Lower Tier-2
Total amount outstanding at March 31, 2012 30.25 148.21 214.28
Of which, amounts raised during the year - - 16.65
Amount eligible to be reckoned as capital funds at
March 31, 2012
30.25 148.21 171.07
e. Total eligible capital (March 31, 2012)
` in billion
Amount
Tier-1 capital 564.98
Tier-2 capital 300.21
Total eligible capital 865.19
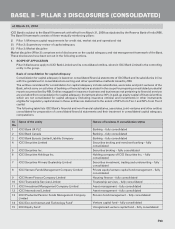
BASEL II – PILLAR 3 DISCLOSURES (CONSOLIDATED)
at March 31, 2012