ICICI Bank 2012 Annual Report Download - page 162
Download and view the complete annual report
Please find page 162 of the 2012 ICICI Bank annual report below. You can navigate through the pages in the report by either clicking on the pages listed below, or by using the keyword search tool below to find specific information within the annual report.-
 1
1 -
2
-
3
-
4
-
5
-
6
-
7
-
8
-
9
-
10
-
11
-
12
-
13
-
14
-
15
-
16
-
17
-
18
-
19
-
20
-
21
-
22
-
23
-
24
-
25
-
26
-
27
-
28
-
29
-
30
-
31
-
32
-
33
-
34
-
35
-
36
-
37
-
38
-
39
-
40
-
41
-
42
-
43
-
44
-
45
-
46
-
47
-
48
-
49
-
50
-
51
-
52
-
53
-
54
-
55
-
56
-
57
-
58
-
59
-
60
-
61
-
62
-
63
-
64
-
65
-
66
-
67
-
68
-
69
-
70
-
71
-
72
-
73
-
74
-
75
-
76
-
77
-
78
-
79
-
80
-
81
-
82
-
83
-
84
-
85
-
86
-
87
-
88
-
89
-
90
-
91
-
92
-
93
-
94
-
95
-
96
-
97
-
98
-
99
-
100
-
101
-
102
-
103
-
104
-
105
-
106
-
107
-
108
-
109
-
110
-
111
-
112
-
113
-
114
-
115
-
116
-
117
-
118
-
119
-
120
-
121
-
122
-
123
-
124
-
125
-
126
-
127
-
128
-
129
-
130
-
131
-
132
-
133
-
134
-
135
-
136
-
137
-
138
-
139
-
140
-
141
-
142
-
143
-
144
-
145
-
146
-
147
-
148
-
149
-
150
-
151
-
 152
152 -
 153
153 -
 154
154 -
 155
155 -
 156
156 -
 157
157 -
 158
158 -
 159
159 -
 160
160 -
 161
161 -
 162
162 -
 163
163 -
 164
164 -
 165
165 -
 166
166 -
 167
167 -
 168
168 -
 169
169 -
 170
170 -
 171
171 -
 172
172 -
173
-
174
-
175
-
176
-
177
-
178
-
179
-
180
-
181
-
182
-
183
-
184
-
185
-
186
-
187
-
188
-
189
-
190
-
191
-
192
-
193
-
194
-
195
-
196
-
197
-
198
-
199
-
200
-
201
-
202
-
203
-
204
-
205
-
206
-
207
-
208
-
209
-
210
-
211
-
212
 |
 |

F84
forming part of the Consolidated Accounts (Contd.)
schedules
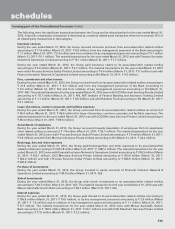
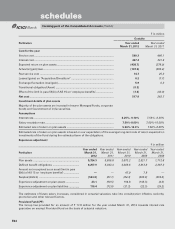
` in million
Gratuity
Particulars Year ended
March 31, 2012
Year ended
March 31, 2011
Cost for the year
Service cost ........................................................................................................... 549.3 460.1
Interest cost ........................................................................................................... 497.4 391.9
Expected return on plan assets ............................................................................ (438.7) (278.9)
Actuarial (gain)/loss ............................................................................................... (107.0) (285.2)
Past service cost ................................................................................................... 14.7 25.2
Losses/(gains) on “Acquisition/Divestiture” ......................................................... 0.2 (7.7)
Exchange fluctuation loss/(gain) ........................................................................... 5.9 0.2
Transitional obligation/(Asset) .............................................................................. (0.3)
Effect of the limit in para 59(b) of AS 15 on ‘employee benefits’ ........................ (3.6) (43.0)
Net cost ................................................................................................................. 517.9 262.7
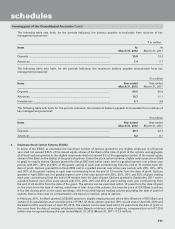
Investment details of plan assets
Majority of the plan assets are invested in Insurer Managed Funds, corporate
bonds and Government of India securities.
Assumptions
Interest rate ............................................................................................................ 8.25%- 9.10% 7.59%- 8.30%
Salary escalation rate ............................................................................................ 7.50%-8.00% 7.00%-10.00%
Estimated rate of return on plan assets ............................................................... 5.00%-10.0% 7.50%-8.00%
Estimated rate of return on plan assets is based on our expectation of the average long-term rate of return expected on
investments of the Fund during the estimated term of the obligations.
Experience adjustment
` in million
Particulars
Year ended
March 31,
2012
Year ended
March 31,
2011
Year ended
March 31,
2010
Year ended
March 31,
2009
Year ended
March 31,
2008
Plan assets .............................................................. 5,724.3 5,855.8 3,073.2 2,521.7 1,712.6
Defined benefit obligations .................................... 6,257.9 5,943.4 3,089.6 2,813.8 2,287.2
Amount not recognised as an asset (limit in para
59(b) of AS 15 on ‘employee benefits’)
..................... —— 47.9 7.9 —
Surplus/(deficit) ...................................................... (533.6) (87.7) (64.3) (300.0) (574.6)
Experience adjustment on plan assets .................. 23.1 (90.5) 194.8 (149.3) (4.0)
Experience adjustment on plan liabilities .............. 119.4 (72.8) (21.2) (22.3) (29.2)
The estimates of future salary increases, considered in actuarial valuation, take into consideration inflation, seniority,
promotion and other relevant factors.
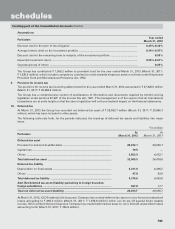
Provident Fund (PF)
The Group has provided for an amount of ` 17.8 million for the year ended March 31, 2012 towards interest rate
guarantee on exempt Provident Fund on the basis of actuarial valuation.