ICICI Bank 2012 Annual Report Download - page 107
Download and view the complete annual report
Please find page 107 of the 2012 ICICI Bank annual report below. You can navigate through the pages in the report by either clicking on the pages listed below, or by using the keyword search tool below to find specific information within the annual report.-
 1
1 -
2
-
3
-
4
-
5
-
6
-
7
-
8
-
9
-
10
-
11
-
12
-
13
-
14
-
15
-
16
-
17
-
18
-
19
-
20
-
21
-
22
-
23
-
24
-
25
-
26
-
27
-
28
-
29
-
30
-
31
-
32
-
33
-
34
-
35
-
36
-
37
-
38
-
39
-
40
-
41
-
42
-
43
-
44
-
45
-
46
-
47
-
48
-
49
-
50
-
51
-
52
-
53
-
54
-
55
-
56
-
57
-
58
-
59
-
60
-
61
-
62
-
63
-
64
-
65
-
66
-
67
-
68
-
69
-
70
-
71
-
72
-
73
-
74
-
75
-
76
-
77
-
78
-
79
-
80
-
81
-
82
-
83
-
84
-
85
-
86
-
87
-
88
-
89
-
90
-
91
-
92
-
93
-
94
-
95
-
96
-
 97
97 -
 98
98 -
 99
99 -
 100
100 -
 101
101 -
 102
102 -
 103
103 -
 104
104 -
 105
105 -
 106
106 -
 107
107 -
 108
108 -
 109
109 -
 110
110 -
 111
111 -
 112
112 -
 113
113 -
 114
114 -
 115
115 -
 116
116 -
 117
117 -
118
-
119
-
120
-
121
-
122
-
123
-
124
-
125
-
126
-
127
-
128
-
129
-
130
-
131
-
132
-
133
-
134
-
135
-
136
-
137
-
138
-
139
-
140
-
141
-
142
-
143
-
144
-
145
-
146
-
147
-
148
-
149
-
150
-
151
-
152
-
153
-
154
-
155
-
156
-
157
-
158
-
159
-
160
-
161
-
162
-
163
-
164
-
165
-
166
-
167
-
168
-
169
-
170
-
171
-
172
-
173
-
174
-
175
-
176
-
177
-
178
-
179
-
180
-
181
-
182
-
183
-
184
-
185
-
186
-
187
-
188
-
189
-
190
-
191
-
192
-
193
-
194
-
195
-
196
-
197
-
198
-
199
-
200
-
201
-
202
-
203
-
204
-
205
-
206
-
207
-
208
-
209
-
210
-
211
-
212
 |
 |

F29
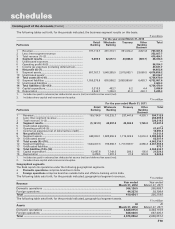
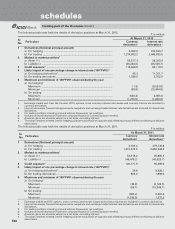
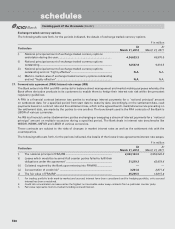
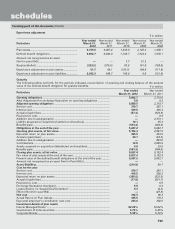
18. Advances
The following table sets forth, for the periods indicated, the details of movement of gross non-performing assets (NPAs),
net NPAs and provisions.
` in million
Particulars Year ended
March 31, 2012
Year ended
March 31, 2011
i) Net NPAs (funded) to net advances (%) 0.73% 1.11%
ii) Movement of NPAs (Gross)
a) Opening balance1 ............................................................................... 100,342.6 94,806.5
b) Additions during the year2 .................................................................. 29,861.2 28,656.3
c) Reductions during the year2,3 .............................................................. (35,450.5) (23,120.2)
d) Closing balance1 .................................................................................. 94,753.3 100,342.6
iii) Movement of Net NPAs
a) Opening balance1 ................................................................................ 24,073.6 38,411.1
b) Additions during the year2 .................................................................. 13,311.6 4,946.4
c) Reductions during the year2,3 .............................................................. (18,776.8) (19,283.9)
d) Closing balance1 .................................................................................. 18,608.4 24,073.6
iv) Movement of provisions for NPAs
(excluding provision on standard assets)
a) Opening balance1 ................................................................................ 76,269.0 56,395.4
b) Provisions made during the year2,3 ..................................................... 20,872.5 27,782.6
c) Write-off/(write-back) of excess provisions2 ..................................... (20,996.6) (7,909.0)
d) Closing balance1 .................................................................................. 76,144.9 76,269.0
1. Net of write-off.
2. Includes cases added to and deleted from NPAs during the year ended March 31, 2012 with such gross loans amounting to `
8,561.8 million (March 31, 2011: ` 5,025.8 million) and such net loans amounting to ` 2,560.7 million (March 31, 2011: ` 3,512.0
million).
3. For NPAs in credit cards, the difference between the opening and closing balances (other than accounts written off during the
year) is included in additions during the year.
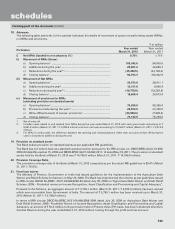
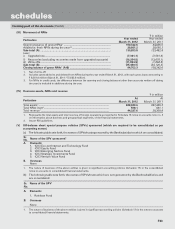
19. Provision on standard assets
The Bank makes provision on standard assets as per applicable RBI guidelines.
The Bank has not written back any standard assets provision pursuant to the RBI circular no. DBOD.BP.BC.83/21.01.002/
2008-09 dated November 15, 2008 and DBOD.BP.BC.94/21.04.048/ 2011-12 dated May 18, 2011. The provision on standard
assets held by the Bank at March 31, 2012 was ` 14,796.0 million (March 31, 2011: ` 14,796.0 million).
20. Provision Coverage Ratio
The provision coverage ratio of the Bank at March 31, 2012 computed as per the extant RBI guidelines is 80.4% (March
31, 2011: 76.0%).
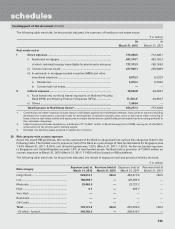
21. Farm loan waiver
The Ministry of Finance, Government of India had issued guidelines for the implementation of the Agriculture Debt
Waiver and Relief Scheme for farmers on May 23, 2008. The Bank has implemented the scheme as per guidelines issued
by RBI circular DBOD No.BP.BC. 26/21.04.048/2008-09 dated July 30, 2008 on “Agricultural Debt Waiver and Debt Relief
Scheme, 2008 – Prudential norms on Income Recognition, Asset Classification and Provisioning and Capital Adequacy”.
Pursuant to the Scheme, an aggregate amount of ` 2,795.1 million (March 31, 2011: ` 2,795.3 million) has been waived
which was recoverable from Government of India. The amount of ` 2,795.1 million has been received up to March 31,
2012 (March 31, 2011: ` 2,788.9 million).
In terms of RBI circular DBOD.No.BP.BC.26/21.04.048/2008-2009 dated July 30, 2008 on Agriculture Debt Waiver and
Debt Relief Scheme, 2008 - Prudential Norms on Income Recognition, Asset Classification and Provisioning and Capital
Adequacy, an amount of ` 50.4 million, being provision held on Present Value (PV) basis, has been transferred directly to
General Reserve during the year ended March 31, 2012 without routing through the profit and loss account.
forming part of the Accounts (Contd.)
schedules