ICICI Bank 2012 Annual Report Download - page 139
Download and view the complete annual report
Please find page 139 of the 2012 ICICI Bank annual report below. You can navigate through the pages in the report by either clicking on the pages listed below, or by using the keyword search tool below to find specific information within the annual report.-
 1
1 -
2
-
3
-
4
-
5
-
6
-
7
-
8
-
9
-
10
-
11
-
12
-
13
-
14
-
15
-
16
-
17
-
18
-
19
-
20
-
21
-
22
-
23
-
24
-
25
-
26
-
27
-
28
-
29
-
30
-
31
-
32
-
33
-
34
-
35
-
36
-
37
-
38
-
39
-
40
-
41
-
42
-
43
-
44
-
45
-
46
-
47
-
48
-
49
-
50
-
51
-
52
-
53
-
54
-
55
-
56
-
57
-
58
-
59
-
60
-
61
-
62
-
63
-
64
-
65
-
66
-
67
-
68
-
69
-
70
-
71
-
72
-
73
-
74
-
75
-
76
-
77
-
78
-
79
-
80
-
81
-
82
-
83
-
84
-
85
-
86
-
87
-
88
-
89
-
90
-
91
-
92
-
93
-
94
-
95
-
96
-
97
-
98
-
99
-
100
-
101
-
102
-
103
-
104
-
105
-
106
-
107
-
108
-
109
-
110
-
111
-
112
-
113
-
114
-
115
-
116
-
117
-
118
-
119
-
120
-
121
-
122
-
123
-
124
-
125
-
126
-
127
-
128
-
 129
129 -
 130
130 -
 131
131 -
 132
132 -
 133
133 -
 134
134 -
 135
135 -
 136
136 -
 137
137 -
 138
138 -
 139
139 -
 140
140 -
 141
141 -
 142
142 -
 143
143 -
 144
144 -
 145
145 -
 146
146 -
 147
147 -
 148
148 -
 149
149 -
150
-
151
-
152
-
153
-
154
-
155
-
156
-
157
-
158
-
159
-
160
-
161
-
162
-
163
-
164
-
165
-
166
-
167
-
168
-
169
-
170
-
171
-
172
-
173
-
174
-
175
-
176
-
177
-
178
-
179
-
180
-
181
-
182
-
183
-
184
-
185
-
186
-
187
-
188
-
189
-
190
-
191
-
192
-
193
-
194
-
195
-
196
-
197
-
198
-
199
-
200
-
201
-
202
-
203
-
204
-
205
-
206
-
207
-
208
-
209
-
210
-
211
-
212
 |
 |

F61
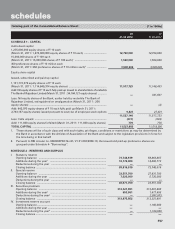
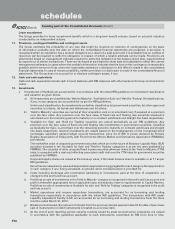
forming part of the Consolidated Balance Sheet (Contd.) (` in ‘000s)
At
31.03.2012
At
31.03.2011
SCHEDULE 8 - INVESTMENTS
I. Investments in India (net of provisions)
i) Government securities ......................................................................... 993,524,949 732,979,973
ii) Other approved securities .................................................................. 4,250 356,398
iii) Shares (includes equity and preference shares)1 .............................. 41,536,762 41,536,041
iv) Debentures and bonds ........................................................................ 254,442,730 206,459,725
v) Assets held to cover linked liabilities of life insurance business ...... 578,173,746 588,265,347
vi) Others (commercial paper, mutual fund units, pass through
certificates, security receipts, certificate of deposits, Rural
Infrastructure Development Fund deposits and other related
investments etc.) .................................................................................. 410,125,260 388,530,238
TOTAL INVESTMENTS IN INDIA .......................................................................... 2,277,807,697 1,958,127,722
II. Investments outside India (net of provisions)
i) Government securities ......................................................................... 67,140,077 54,619,909
ii) Others ................................................................................................... 53,693,138 83,780,160
TOTAL INVESTMENTS OUTSIDE INDIA .............................................................. 120,833,215 138,400,069
TOTAL INVESTMENTS .......................................................................................... 2,398,640,912 2,096,527,791
III. Investments in India
Gross value of investments2 ......................................................................... 2,305,164,599 1,984,587,186
Less: Aggregate of provision/depreciation/(appreciation) .......................... 27,356,902 26,459,464
Net investments............................................................................................. 2,277,807,697 1,958,127,722
IV. Investments outside India
Gross value of investments .......................................................................... 123,846,674 141,810,619
Less: Aggregate of provision/depreciation/(appreciation) .......................... 3,013,459 3,410,550
Net investments............................................................................................. 120,833,215 138,400,069
TOTAL INVESTMENTS .......................................................................................... 2,398,640,912 2,096,527,791
1. Includes acquisition cost of investment in associates of ` 494.9 million (March 31, 2011: ` 578.7 million).
2. Includes appreciation of ` 27,322.5 million (appreciation in March 31, 2011: ` 72,320.7 million) on investments held to cover linked liabilities of
life insurance business.
SCHEDULE 9 - ADVANCES (net of provisions)
A. i) Bills purchased and discounted ............................................................... 59,774,883 70,301,265
ii) Cash credits, overdrafts and loans repayable on demand ..................... 322,483,353 307,352,546
iii) Term loans ................................................................................................ 2,319,891,049 2,057,775,362
iv) Securitisation, finance lease and hire purchase receivables .................. 219,104,894 124,763,964
TOTAL ADVANCES ........................................................................................................... 2,921,254,179 2,560,193,137
B. i) Secured by tangible assets [includes advances against book debts] ... 2,426,141,317 1,922,059,342
ii) Covered by bank/government guarantees .............................................. 13,869,020 27,057,409
iii) Unsecured ................................................................................................. 481,243,842 611,076,386
TOTAL ADVANCES .......................................................................................................... 2,921,254,179 2,560,193,137
C. I. Advances in India
i) Priority sector ............................................................................................ 592,856,433 534,015,609
ii) Public sector .............................................................................................. 11,968,345 13,788,639
iii) Banks ......................................................................................................... 154,618 1,810,607
iv) Others ....................................................................................................... 1,290,662,186 1,132,200,854
TOTAL ADVANCES IN INDIA 1,895,641,582 1,681,815,709
II. Advances outside India
i) Due from banks ......................................................................................... 27,655,594 43,708,080
ii) Due from others
a) Bills purchased and discounted ...................................................... 6,357,136 11,610,861
b) Syndicated and term loans ............................................................. 845,174,352 752,209,407
c) Others .............................................................................................. 146,425,515 70,849,080
TOTAL ADVANCES OUTSIDE INDIA ............................................................................... 1,025,612,597 878,377,428
TOTAL ADVANCES ........................................................................................................... 2,921,254,179 2,560,193,137
schedules