ICICI Bank 2012 Annual Report Download - page 30
Download and view the complete annual report
Please find page 30 of the 2012 ICICI Bank annual report below. You can navigate through the pages in the report by either clicking on the pages listed below, or by using the keyword search tool below to find specific information within the annual report.-
 1
1 -
2
-
3
-
4
-
5
-
6
-
7
-
8
-
9
-
10
-
11
-
12
-
13
-
14
-
15
-
16
-
17
-
18
-
19
-
 20
20 -
 21
21 -
 22
22 -
 23
23 -
 24
24 -
 25
25 -
 26
26 -
 27
27 -
 28
28 -
 29
29 -
 30
30 -
 31
31 -
 32
32 -
 33
33 -
 34
34 -
 35
35 -
 36
36 -
 37
37 -
 38
38 -
 39
39 -
 40
40 -
41
-
42
-
43
-
44
-
45
-
46
-
47
-
48
-
49
-
50
-
51
-
52
-
53
-
54
-
55
-
56
-
57
-
58
-
59
-
60
-
61
-
62
-
63
-
64
-
65
-
66
-
67
-
68
-
69
-
70
-
71
-
72
-
73
-
74
-
75
-
76
-
77
-
78
-
79
-
80
-
81
-
82
-
83
-
84
-
85
-
86
-
87
-
88
-
89
-
90
-
91
-
92
-
93
-
94
-
95
-
96
-
97
-
98
-
99
-
100
-
101
-
102
-
103
-
104
-
105
-
106
-
107
-
108
-
109
-
110
-
111
-
112
-
113
-
114
-
115
-
116
-
117
-
118
-
119
-
120
-
121
-
122
-
123
-
124
-
125
-
126
-
127
-
128
-
129
-
130
-
131
-
132
-
133
-
134
-
135
-
136
-
137
-
138
-
139
-
140
-
141
-
142
-
143
-
144
-
145
-
146
-
147
-
148
-
149
-
150
-
151
-
152
-
153
-
154
-
155
-
156
-
157
-
158
-
159
-
160
-
161
-
162
-
163
-
164
-
165
-
166
-
167
-
168
-
169
-
170
-
171
-
172
-
173
-
174
-
175
-
176
-
177
-
178
-
179
-
180
-
181
-
182
-
183
-
184
-
185
-
186
-
187
-
188
-
189
-
190
-
191
-
192
-
193
-
194
-
195
-
196
-
197
-
198
-
199
-
200
-
201
-
202
-
203
-
204
-
205
-
206
-
207
-
208
-
209
-
210
-
211
-
212
 |
 |
28
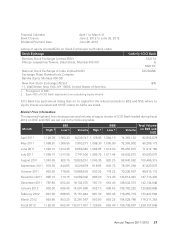
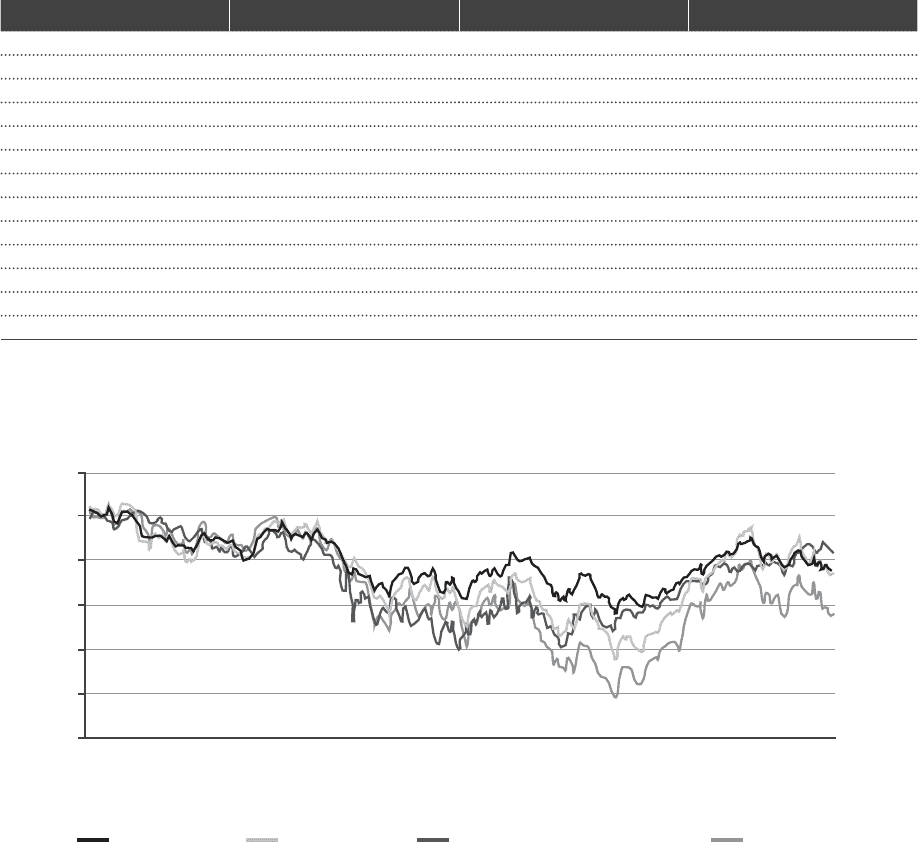
The reported high and low closing prices and volume of ADSs of ICICI Bank traded during fiscal 2012
on the NYSE are given below:
Month High (US$) Low (US$) Number of ADS traded
April 2011 50.67 48.50 27,320,523
May 2011 49.30 44.83 31,197,646
June 2011 49.30 45.32 31,925,960
July 2011 50.00 45.63 25,277,290
August 2011 47.28 35.92 50,386,163
September 2011 39.51 34.00 45,462,116
October 2011 38.88 31.94 54,575,200
November 2011 36.12 27.44 52,420,629
December 2011 30.72 24.43 49,714,662
January 2012 36.21 27.90 60,734,163
February 2012 39.79 36.06 51,370,232
March 2012 38.08 33.77 45,480,772
Fiscal 2012 50.67 24.43 525,865,356
The performance of the ICICI Bank equity share relative to the BSE Sensitive Index (Sensex), BSE Bank
Index (Bankex) and NYSE Financial Index during the period April 1, 2011 to March 31, 2012 is given in
the following chart:
110.00
100.00
90.00
80.00
70.00
60.00
50.00
Sensex Bankex NYSE Financial Index ICICI Bank
Apr 11
May 11
Jun 11
Jul 11
Aug 11
Sep 11
Oct 11
Nov 11
Dec 11
Jan 12
Feb 12
Mar 12
Share Transfer System
ICICI Bank’s investor services are handled by 3i Infotech Limited (3i Infotech). 3i Infotech is a SEBI
registered Category I – Registrar to an Issue & Share Transfer (R&T) Agent. 3i Infotech is a global
information technology company providing technology solutions and in addition to R&T services provides
software products, managed IT Services, application software development & maintenance, payment
solutions, business intelligence, document imaging & digitisation, IT consulting and various transaction
processing services. 3i Infotech’s quality certifications include SEI CMMI Level 5 for software business,
ISO 9001:2000 for BPO (including R&T) and ISO 27001:2005 for infrastructure services.
ICICI Bank’s equity shares are traded mainly in dematerialised form. During the year, 1,385,899 equity
shares involving 6,158 certificates were dematerialised. At March 31, 2012, 99.31% of paid-up equity
share capital (including equity shares represented by ADS constituting 26.85% of the paid-up equity
share capital) are held in dematerialised form.
Directors’ Report