ICICI Bank 2012 Annual Report Download - page 54
Download and view the complete annual report
Please find page 54 of the 2012 ICICI Bank annual report below. You can navigate through the pages in the report by either clicking on the pages listed below, or by using the keyword search tool below to find specific information within the annual report.-
 1
1 -
2
-
3
-
4
-
5
-
6
-
7
-
8
-
9
-
10
-
11
-
12
-
13
-
14
-
15
-
16
-
17
-
18
-
19
-
20
-
21
-
22
-
23
-
24
-
25
-
26
-
27
-
28
-
29
-
30
-
31
-
32
-
33
-
34
-
35
-
36
-
37
-
38
-
39
-
40
-
41
-
42
-
43
-
 44
44 -
 45
45 -
 46
46 -
 47
47 -
 48
48 -
 49
49 -
 50
50 -
 51
51 -
 52
52 -
 53
53 -
 54
54 -
 55
55 -
 56
56 -
 57
57 -
 58
58 -
 59
59 -
 60
60 -
 61
61 -
 62
62 -
 63
63 -
 64
64 -
65
-
66
-
67
-
68
-
69
-
70
-
71
-
72
-
73
-
74
-
75
-
76
-
77
-
78
-
79
-
80
-
81
-
82
-
83
-
84
-
85
-
86
-
87
-
88
-
89
-
90
-
91
-
92
-
93
-
94
-
95
-
96
-
97
-
98
-
99
-
100
-
101
-
102
-
103
-
104
-
105
-
106
-
107
-
108
-
109
-
110
-
111
-
112
-
113
-
114
-
115
-
116
-
117
-
118
-
119
-
120
-
121
-
122
-
123
-
124
-
125
-
126
-
127
-
128
-
129
-
130
-
131
-
132
-
133
-
134
-
135
-
136
-
137
-
138
-
139
-
140
-
141
-
142
-
143
-
144
-
145
-
146
-
147
-
148
-
149
-
150
-
151
-
152
-
153
-
154
-
155
-
156
-
157
-
158
-
159
-
160
-
161
-
162
-
163
-
164
-
165
-
166
-
167
-
168
-
169
-
170
-
171
-
172
-
173
-
174
-
175
-
176
-
177
-
178
-
179
-
180
-
181
-
182
-
183
-
184
-
185
-
186
-
187
-
188
-
189
-
190
-
191
-
192
-
193
-
194
-
195
-
196
-
197
-
198
-
199
-
200
-
201
-
202
-
203
-
204
-
205
-
206
-
207
-
208
-
209
-
210
-
211
-
212
 |
 |

52
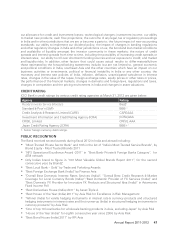
We continued to expand our branch network in India. Our branch network in India increased from 2,529
branches and extension counters at March 31, 2011 to 2,752 branches and extension counters at
March 31, 2012. We also increased our ATM network from 6,104 ATMs at March 31, 2011 to 9,006 ATMs
at March 31, 2012.
The total capital adequacy ratio of ICICI Bank on a standalone basis at March 31, 2012 in accordance with
RBI guidelines on Basel II was 18.5% with a Tier I capital adequacy ratio of 12.7% compared to a total capital
adequacy ratio of 19.5% and Tier I capital adequacy ratio of 13.2% at March 31, 2011.
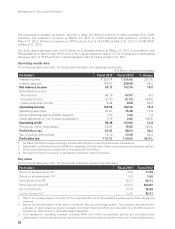
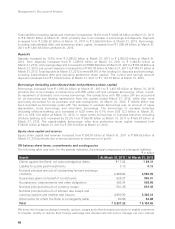
Operating results data
The following table sets forth, for the periods indicated, the operating results data.
` in billion, except percentages
Particulars Fiscal 2011 Fiscal 2012 % change
Interest income ` 259.74 ` 335.42 29.1%
Interest expense 169.57 228.08 34.5
Net interest income 90.17 107.34 19.0
Non-interest income
- Fee income164.19 67.07 4.5
- Treasury income (2.15) (0.13) (94.0)
- Lease and other income 4.44 8.08 82.0
Operating income 156.65 182.36 16.4
Operating expenses 63.81 76.48 19.9
Direct marketing agency (DMA) expense21.57 1.60 1.9
Lease depreciation, net of lease equalisation 0.79 0.42 (46.8)
Operating profit 90.48 103.86 14.8
Provisions, net of write-backs 22.87 15.83 (30.8)
Profit before tax 67.61 88.03 30.2
Tax, including deferred tax 16.10 23.38 45.2
Profit after tax ` 51.51 ` 64.65 25.5%
1. Includes merchant foreign exchange income and margin on customer derivative transactions.
2. Represents commissions paid to DMAs for origination of retail loans. These commissions are expensed upfront.
3. All amounts have been rounded off to the nearest ` 10.0 million.
4. Prior period figures have been re-grouped/re-arranged, where necessary.
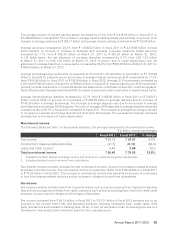
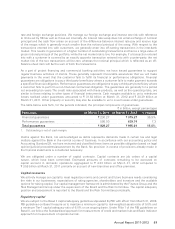
Key ratios
The following table sets forth, for the periods indicated, the key financial ratios.
Particulars Fiscal 2011 Fiscal 2012
Return on average equity (%)19.58 11.09
Return on average assets (%)21.34 1.50
Earnings per share (`) 45.27 56.11
Book value per share (`) 478.31 524.03
Fee to income (%) 41.18 36.86
Cost to income (%)341.95 42.91
1. Return on average equity is the ratio of the net profit after tax to the quarterly average equity share capital and
reserves.
2. Return on average assets is the ratio of net profit after tax to average assets. The average balances are the
averages of daily balances, except averages of foreign branches which are calculated on a monthly basis till
October 31, 2010 and on a fortnightly basis thereafter.
3. Cost represents operating expense including DMA cost which is expensed upfront but excluding lease
depreciation. Income represents net interest income and non-interest income and is net of lease depreciation.
Management’s Discussion & Analysis