ICICI Bank 2012 Annual Report Download - page 117
Download and view the complete annual report
Please find page 117 of the 2012 ICICI Bank annual report below. You can navigate through the pages in the report by either clicking on the pages listed below, or by using the keyword search tool below to find specific information within the annual report.-
 1
1 -
2
-
3
-
4
-
5
-
6
-
7
-
8
-
9
-
10
-
11
-
12
-
13
-
14
-
15
-
16
-
17
-
18
-
19
-
20
-
21
-
22
-
23
-
24
-
25
-
26
-
27
-
28
-
29
-
30
-
31
-
32
-
33
-
34
-
35
-
36
-
37
-
38
-
39
-
40
-
41
-
42
-
43
-
44
-
45
-
46
-
47
-
48
-
49
-
50
-
51
-
52
-
53
-
54
-
55
-
56
-
57
-
58
-
59
-
60
-
61
-
62
-
63
-
64
-
65
-
66
-
67
-
68
-
69
-
70
-
71
-
72
-
73
-
74
-
75
-
76
-
77
-
78
-
79
-
80
-
81
-
82
-
83
-
84
-
85
-
86
-
87
-
88
-
89
-
90
-
91
-
92
-
93
-
94
-
95
-
96
-
97
-
98
-
99
-
100
-
101
-
102
-
103
-
104
-
105
-
106
-
 107
107 -
 108
108 -
 109
109 -
 110
110 -
 111
111 -
 112
112 -
 113
113 -
 114
114 -
 115
115 -
 116
116 -
 117
117 -
 118
118 -
 119
119 -
 120
120 -
 121
121 -
 122
122 -
 123
123 -
 124
124 -
 125
125 -
 126
126 -
 127
127 -
128
-
129
-
130
-
131
-
132
-
133
-
134
-
135
-
136
-
137
-
138
-
139
-
140
-
141
-
142
-
143
-
144
-
145
-
146
-
147
-
148
-
149
-
150
-
151
-
152
-
153
-
154
-
155
-
156
-
157
-
158
-
159
-
160
-
161
-
162
-
163
-
164
-
165
-
166
-
167
-
168
-
169
-
170
-
171
-
172
-
173
-
174
-
175
-
176
-
177
-
178
-
179
-
180
-
181
-
182
-
183
-
184
-
185
-
186
-
187
-
188
-
189
-
190
-
191
-
192
-
193
-
194
-
195
-
196
-
197
-
198
-
199
-
200
-
201
-
202
-
203
-
204
-
205
-
206
-
207
-
208
-
209
-
210
-
211
-
212
 |
 |

F39
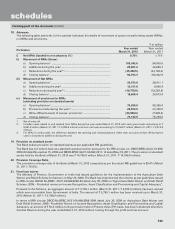
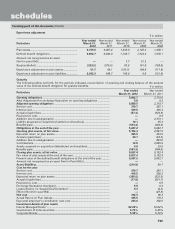
Experience adjustment
` in million
Particulars
Year ended
March 31,
2012
Year ended
March 31,
2011
Year ended
March 31,
2010
Year ended
March 31,
2009
Year ended
March 31,
2008
Plan assets ............................................................... 9,379.5 8,467.4 1,839.9 2,145.3 1,490.1
Defined benefit obligations ..................................... 9,602.7 8,842.9 1,748.7 1,932.2 1,678.1
Amount not recognised as an asset
(limit in para 59(b) ................................................... —— 7.7 51.2 —
Surplus/(deficit) ....................................................... (223.2) (375.5) 83.5 161.9 (188.0)
Experience adjustment on plan assets ................... 51.7 69.1 (130.7) 144.8 (117.9)
Experience adjustment on plan liabilities ............... 2,692.3 689.7 196.9 6.6 (121.9)
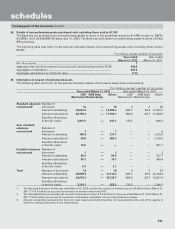
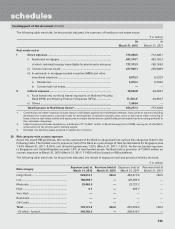
Gratuity
The following tables set forth, for the periods indicated, reconciliation of opening and closing balance of the present
value of the defined benefit obligation for gratuity benefits. ` in million
Particulars Year ended
March 31, 2012
Year ended
March 31, 2011
Opening obligations ........................................................................................... 5,082.7 2,310.5
Add: Adjustment for exchange fluctuation on opening obligations ................ 5.8 0.2
Adjusted opening obligations ........................................................................... 5,088.5 2,310.7
Service cost ......................................................................................................... 379.7 297.1
Interest cost ......................................................................................................... 419.5 326.3
Actuarial (gain)/loss ............................................................................................. (57.4) (324.9)
Past service cost .................................................................................................. —9.9
Addition due to amalgamation ........................................................................... —2,773.1
Liability assumed on acquisition/(settled on divestiture) .................................. 10.1 35.3
Benefits paid ........................................................................................................ (593.2) (344.8)
Obligations at the end of the year .................................................................... 5,247.2 5,082.7
Opening plan assets, at fair value ..................................................................... 5,182.4 2,507.5
Expected return on plan assets .......................................................................... 395.5 233.5
Actuarial gain/(loss) ............................................................................................. 20.1 (63.2)
Addition due to amalgamation ........................................................................... —803.0
Contributions ....................................................................................................... 12.8 2,006.9
Assets acquired on acquisition/(distributed on divestiture) .............................. 9.8 39.5
Benefits paid ........................................................................................................ (593.2) (344.8)
Closing plan assets, at fair value ....................................................................... 5,027.4 5,182.4
Fair value of plan assets at the end of the year ................................................. 5,027.4 5,182.4
Present value of the defined benefit obligations at the end of the year ........... 5,247.2 5,082.7
Amount not recognised as an asset (limit in Para 59(b)) ................................... ——
Asset/(liability).................................................................................................... (219.8) 99.7
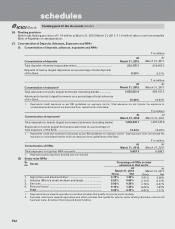
Cost for the year
Service cost ......................................................................................................... 379.7 297.1
Interest cost ......................................................................................................... 419.5 326.3
Expected return on plan assets .......................................................................... (395.5) (233.5)
Actuarial (gain)/loss ............................................................................................. (77.5) (261.7)
Past service cost .................................................................................................. —9.9
Exchange fluctuation loss/(gain) ......................................................................... 5.8 0.2
Losses/(Gains) on “Acquisition/Divestiture” ....................................................... 0.3 (4.2)
Effect of the limit in para 59(b)
.................................................................................. —(47.9)
Net cost ............................................................................................................... 332.3 86.2
Actual Return on Plan Assets.............................................................................. 415.5 170.3
Expected employer’s contribution next year ..................................................... 253.6 382.0
Investment details of plan assets
Insurer Managed Funds1 ..................................................................................... 82.65% 79.84%
Government of India securities ........................................................................... 4.74% 6.45%
Corporate Bonds ................................................................................................. 5.98% 5.39%
forming part of the Accounts (Contd.)
schedules