ICICI Bank 2012 Annual Report Download - page 56
Download and view the complete annual report
Please find page 56 of the 2012 ICICI Bank annual report below. You can navigate through the pages in the report by either clicking on the pages listed below, or by using the keyword search tool below to find specific information within the annual report.-
 1
1 -
2
-
3
-
4
-
5
-
6
-
7
-
8
-
9
-
10
-
11
-
12
-
13
-
14
-
15
-
16
-
17
-
18
-
19
-
20
-
21
-
22
-
23
-
24
-
25
-
26
-
27
-
28
-
29
-
30
-
31
-
32
-
33
-
34
-
35
-
36
-
37
-
38
-
39
-
40
-
41
-
42
-
43
-
44
-
45
-
 46
46 -
 47
47 -
 48
48 -
 49
49 -
 50
50 -
 51
51 -
 52
52 -
 53
53 -
 54
54 -
 55
55 -
 56
56 -
 57
57 -
 58
58 -
 59
59 -
 60
60 -
 61
61 -
 62
62 -
 63
63 -
 64
64 -
 65
65 -
 66
66 -
67
-
68
-
69
-
70
-
71
-
72
-
73
-
74
-
75
-
76
-
77
-
78
-
79
-
80
-
81
-
82
-
83
-
84
-
85
-
86
-
87
-
88
-
89
-
90
-
91
-
92
-
93
-
94
-
95
-
96
-
97
-
98
-
99
-
100
-
101
-
102
-
103
-
104
-
105
-
106
-
107
-
108
-
109
-
110
-
111
-
112
-
113
-
114
-
115
-
116
-
117
-
118
-
119
-
120
-
121
-
122
-
123
-
124
-
125
-
126
-
127
-
128
-
129
-
130
-
131
-
132
-
133
-
134
-
135
-
136
-
137
-
138
-
139
-
140
-
141
-
142
-
143
-
144
-
145
-
146
-
147
-
148
-
149
-
150
-
151
-
152
-
153
-
154
-
155
-
156
-
157
-
158
-
159
-
160
-
161
-
162
-
163
-
164
-
165
-
166
-
167
-
168
-
169
-
170
-
171
-
172
-
173
-
174
-
175
-
176
-
177
-
178
-
179
-
180
-
181
-
182
-
183
-
184
-
185
-
186
-
187
-
188
-
189
-
190
-
191
-
192
-
193
-
194
-
195
-
196
-
197
-
198
-
199
-
200
-
201
-
202
-
203
-
204
-
205
-
206
-
207
-
208
-
209
-
210
-
211
-
212
 |
 |
54
Yield on average interest-earning investments increased from 6.39% in fiscal 2011 to 7.24% in fiscal
2012 primarily due to investment in Statutory Liquidity Ratio (SLR) securities at higher yields and reset
of interest rates on floating rate bonds at higher levels. The yield on average interest-earning non-SLR
investments increased from 6.55% in fiscal 2011 to 7.10% in fiscal 2012, primarily due to an increase in
investment in higher-yielding credit substitutes like corporate bonds and debentures.
Interest income also includes interest on income tax refund of ` 0.80 billion in fiscal 2012 compared to
` 1.65 billion in fiscal 2011. The receipt, amount and timing of such income depends on the nature and
timing of determinations by tax authorities and is not consistent or predictable.
During fiscal 2012, interest income was also impacted by losses on securitised pools of assets (including
credit losses on existing pools) of ` 2.02 billion as compared to ` 5.49 billion in fiscal 2011.
RBI reduced the CRR by 50 basis points from 6.00% to 5.50% with effect from January 28, 2012 and
further by 75 basis points to 4.75% with effect from March 10, 2012. As CRR balances do not earn any
interest income, these reductions had a positive impact on the overall yield in fiscal 2012.
The cost of funds increased from 5.35% in fiscal 2011 to 6.33% in fiscal 2012 primarily due to the following factors:
The cost of deposits increased from 4.92% in fiscal 2011 to 6.12% in fiscal 2012. The cost of average term
deposits increased from 6.51% in fiscal 2011 to 8.21% in fiscal 2012 reflecting the impact of increase in
deposit rates seen from the second half of fiscal 2011. The deposit rates continued to increase during
fiscal 2012 in line with system rates due to tight systemic liquidity, the rising interest rate environment
and monetary policy stance of RBI. The impact of the increase in deposits rates in fiscal 2011 and further
increase in deposit rates during fiscal 2012 is reflected in higher cost of deposits.
RBI increased the rate on savings account deposits to 4.00% on daily average balances with effect from
May 3, 2011 resulting in an increase in cost of average savings account deposits in fiscal 2012 compared
to fiscal 2011. In its second quarter review of monetary policy 2011-12 issued on October 25, 2011, RBI
deregulated the savings bank deposit interest rate with immediate effect and banks are free to determine
their savings bank deposit interest rate. Any increase in the savings deposit rate by the Bank will result
in increase in cost of deposits.
Cost of borrowings increased from 6.14% in fiscal 2011 to 6.71% in fiscal 2012 primarily on account of
increase in cost of refinance borrowings and call and term borrowings in line with movement in market rates.
Net interest margin of overseas branches improved from 0.88% for fiscal 2011 to 1.23% for fiscal 2012
primarily due to increase in yield on overseas advances. Yield on overseas advances increased primarily due
to new disbursements at higher interest rates and repayment and prepayment of low yielding loans.
The reduction of CRR by 125 basis points to 4.75% and a reduction in repo rate by 50 basis points to
8.00% by RBI, indicates a reversal in policy stance. While the interest rates in the system are believed to
have peaked the extent and timing of decline in interest rates will depend on systemic liquidity, the future
movement of inflation as well as on the evolving fiscal situation.
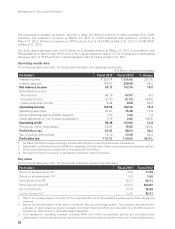
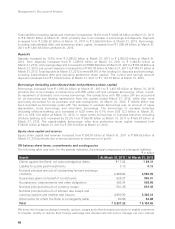
The following table sets forth, for the period indicated, the trend in average interest-earning assets and
average interest-bearing liabilities: ` in billion, except percentages
Fiscal 2011 Fiscal 2012 % change
Advances ` 1,926.52 ` 2,316.69 20.3%
Interest-earning investments 1,237.42 1,337.46 8.1
Other interest-earning assets 254.65 278.44 9.3
Total interest-earning assets 3,418.59 3,932.59 15.0
Deposits 2,046.04 2,335.93 14.2
Borrowings31,122.23 1,267.58 13.0
Total interest-bearing liabilities ` 3,168.26 ` 3,603.51 13.7%
1. Average investments and average borrowings include average short-term re-purchase transactions.
2. Average balances are the averages of daily balances, except averages of foreign branches which are calculated
on a monthly basis till October 31, 2010 and on a fortnightly basis thereafter.
3. Borrowings exclude preference share capital.
Management’s Discussion & Analysis