ICICI Bank 2012 Annual Report Download - page 60
Download and view the complete annual report
Please find page 60 of the 2012 ICICI Bank annual report below. You can navigate through the pages in the report by either clicking on the pages listed below, or by using the keyword search tool below to find specific information within the annual report.-
 1
1 -
2
-
3
-
4
-
5
-
6
-
7
-
8
-
9
-
10
-
11
-
12
-
13
-
14
-
15
-
16
-
17
-
18
-
19
-
20
-
21
-
22
-
23
-
24
-
25
-
26
-
27
-
28
-
29
-
30
-
31
-
32
-
33
-
34
-
35
-
36
-
37
-
38
-
39
-
40
-
41
-
42
-
43
-
44
-
45
-
46
-
47
-
48
-
49
-
 50
50 -
 51
51 -
 52
52 -
 53
53 -
 54
54 -
 55
55 -
 56
56 -
 57
57 -
 58
58 -
 59
59 -
 60
60 -
 61
61 -
 62
62 -
 63
63 -
 64
64 -
 65
65 -
 66
66 -
 67
67 -
 68
68 -
 69
69 -
 70
70 -
71
-
72
-
73
-
74
-
75
-
76
-
77
-
78
-
79
-
80
-
81
-
82
-
83
-
84
-
85
-
86
-
87
-
88
-
89
-
90
-
91
-
92
-
93
-
94
-
95
-
96
-
97
-
98
-
99
-
100
-
101
-
102
-
103
-
104
-
105
-
106
-
107
-
108
-
109
-
110
-
111
-
112
-
113
-
114
-
115
-
116
-
117
-
118
-
119
-
120
-
121
-
122
-
123
-
124
-
125
-
126
-
127
-
128
-
129
-
130
-
131
-
132
-
133
-
134
-
135
-
136
-
137
-
138
-
139
-
140
-
141
-
142
-
143
-
144
-
145
-
146
-
147
-
148
-
149
-
150
-
151
-
152
-
153
-
154
-
155
-
156
-
157
-
158
-
159
-
160
-
161
-
162
-
163
-
164
-
165
-
166
-
167
-
168
-
169
-
170
-
171
-
172
-
173
-
174
-
175
-
176
-
177
-
178
-
179
-
180
-
181
-
182
-
183
-
184
-
185
-
186
-
187
-
188
-
189
-
190
-
191
-
192
-
193
-
194
-
195
-
196
-
197
-
198
-
199
-
200
-
201
-
202
-
203
-
204
-
205
-
206
-
207
-
208
-
209
-
210
-
211
-
212
 |
 |

58
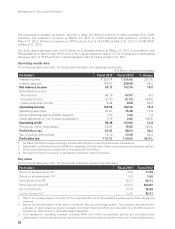
Provision for investments increased from ` 2.04 billion in fiscal 2011 to ` 4.13 billion in fiscal 2012 primarily
due to permanent diminution recognised on certain investments.
Our provisioning coverage ratio at March 31, 2012 computed as per the RBI guidelines was 80.4%.
No additional general provision was required on standard assets during fiscal 2012. RBI guidelines do not
permit write-back of excess provisions already made and therefore we held a cumulative general provision
of ` 14.80 billion at March 31, 2012 compared to the general provision requirement of about ` 13.82 billion.
Tax expense
The income tax expense (including wealth tax) increased by 45.2% from ` 16.10 billion in fiscal 2011 to
` 23.38 billion in fiscal 2012. The effective tax rate of 26.6% in fiscal 2012 was higher compared to the
effective tax rate of 23.8% in fiscal 2011. The effective tax rate for fiscal 2011 included tax benefits related to
the amalgamation of Bank of Rajasthan.
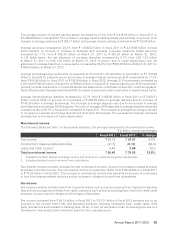
Financial condition
Assets
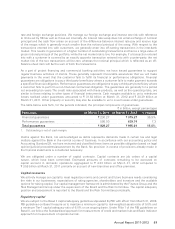
The following table sets forth, at the dates indicated, the principal components of assets.
` in billion, except percentages
Assets At March 31, 2011 At March 31, 2012 % change
Cash and bank balances ` 340.90 ` 362.29 6.3%
Investments 1,346.86 1,595.60 18.5
- Government and other approved securities1641.61 869.48 35.5
- RIDF and other related investments2150.80 181.03 20.0
- Equity investment in subsidiaries 124.53 124.53 —
- Other investments 429.92 420.56 (2.2)
Advances 2,163.66 2,537.28 17.3
- Domestic 1,612.69 1,843.25 14.3
- Overseas branches 550.97 694.03 26.0
Fixed assets (including leased assets) 47.44 46.15 (2.7)
Other assets 163.48 195.15 19.4
Total assets ` 4,062.34 ` 4,736.47 16.6%
1. Banks in India are required to maintain a specified percentage, currently 24.0%, of their net demand and time
liabilities by way of liquid assets like cash, gold or approved unencumbered securities.
2. Investments made in RIDF and other such entities in lieu of shortfall in the amount required to be lent to certain
specified sectors called priority sector as per RBI guidelines.
3. All amounts have been rounded off to the nearest ` 10.0 million.
Total assets increased by 16.6% from ` 4,062.34 billion at March 31, 2011 to ` 4,736.47 billion at March 31,
2012, primarily due to an increase in advances and investments. Net advances increased by 17.3% from
` 2,163.66 billion at March 31, 2011 to ` 2,537.28 billion at March 31, 2012. Investments increased by 18.5%
from ` 1,346.86 billion at March 31, 2011 to ` 1,595.60 billion at March 31, 2012.
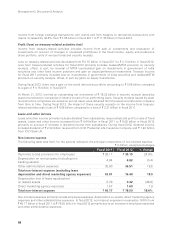
Cash and cash equivalents
Cash and cash equivalents include cash in hand and balances with RBI and other banks, including money
at call and short notice. Cash and cash equivalents increased from ` 340.90 billion at March 31, 2011 to
` 362.29 billion at March 31, 2012. The increase was primarily due to an increase in term money lending
and call money lending by overseas branches. The balances with RBI decreased from ` 171.23 billion at
March 31, 2011 to ` 157.92 billion at March 31, 2012 primarily due to reduction in CRR by 125 basis points
from 6.00% at March 31, 2011 to 4.75% at March 31, 2012.
Management’s Discussion & Analysis