ICICI Bank 2012 Annual Report Download - page 64
Download and view the complete annual report
Please find page 64 of the 2012 ICICI Bank annual report below. You can navigate through the pages in the report by either clicking on the pages listed below, or by using the keyword search tool below to find specific information within the annual report.-
 1
1 -
2
-
3
-
4
-
5
-
6
-
7
-
8
-
9
-
10
-
11
-
12
-
13
-
14
-
15
-
16
-
17
-
18
-
19
-
20
-
21
-
22
-
23
-
24
-
25
-
26
-
27
-
28
-
29
-
30
-
31
-
32
-
33
-
34
-
35
-
36
-
37
-
38
-
39
-
40
-
41
-
42
-
43
-
44
-
45
-
46
-
47
-
48
-
49
-
50
-
51
-
52
-
53
-
 54
54 -
 55
55 -
 56
56 -
 57
57 -
 58
58 -
 59
59 -
 60
60 -
 61
61 -
 62
62 -
 63
63 -
 64
64 -
 65
65 -
 66
66 -
 67
67 -
 68
68 -
 69
69 -
 70
70 -
 71
71 -
 72
72 -
 73
73 -
 74
74 -
75
-
76
-
77
-
78
-
79
-
80
-
81
-
82
-
83
-
84
-
85
-
86
-
87
-
88
-
89
-
90
-
91
-
92
-
93
-
94
-
95
-
96
-
97
-
98
-
99
-
100
-
101
-
102
-
103
-
104
-
105
-
106
-
107
-
108
-
109
-
110
-
111
-
112
-
113
-
114
-
115
-
116
-
117
-
118
-
119
-
120
-
121
-
122
-
123
-
124
-
125
-
126
-
127
-
128
-
129
-
130
-
131
-
132
-
133
-
134
-
135
-
136
-
137
-
138
-
139
-
140
-
141
-
142
-
143
-
144
-
145
-
146
-
147
-
148
-
149
-
150
-
151
-
152
-
153
-
154
-
155
-
156
-
157
-
158
-
159
-
160
-
161
-
162
-
163
-
164
-
165
-
166
-
167
-
168
-
169
-
170
-
171
-
172
-
173
-
174
-
175
-
176
-
177
-
178
-
179
-
180
-
181
-
182
-
183
-
184
-
185
-
186
-
187
-
188
-
189
-
190
-
191
-
192
-
193
-
194
-
195
-
196
-
197
-
198
-
199
-
200
-
201
-
202
-
203
-
204
-
205
-
206
-
207
-
208
-
209
-
210
-
211
-
212
 |
 |

62
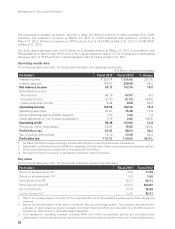
RBI has also stipulated that banks shall maintain capital at higher of the minimum capital required as per
Basel II or 80% of the minimum capital required as per Basel I. At March 31, 2012, the prudential floor at
80% of the minimum capital requirement under Basel I was ` 332.50 billion and was lower than the minimum
capital requirement of ` 358.73 billion under Basel II. Hence, we have maintained capital adequacy at
March 31, 2012 as per the Basel II norms.
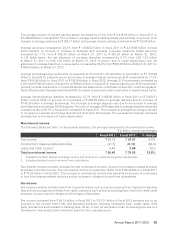
The following table sets forth, at the dates indicated, the capital adequacy ratios computed in accordance
with the RBI guidelines on Basel I and Basel II.
` in billion
As per RBI
guidelines on Basel I
As per RBI
guidelines on Basel II
At March 31,
2011
At March 31,
2012
At March 31,
2011
At March 31,
2012
Tier-I capital ` 463.99 ` 512.16 ` 449.75 ` 505.18
Tier-II capital 231.00 238.56 217.50 232.95
Total capital 694.99 750.72 667.25 738.13
Credit Risk — Risk Weighted Assets (RWA) 3,389.35 4,054.73 2,909.79 3,468.74
Market Risk — RWA 552.84 563.31 255.52 268.66
Operational Risk — RWA — —249.67 248.46
Total RWA ` 3,942.19 ` 4,618.04 ` 3,414.98 ` 3,985.86
Total capital adequacy ratio 17.6% 16.3% 19.5% 18.5%
Tier-I capital adequacy ratio 11.8% 11.1% 13.2% 12.7%
Tier-II capital adequacy ratio 5.8% 5.2% 6.3% 5.8%
Movement in our capital funds and risk weighted assets from March 31, 2011 to March 31, 2012
(as per RBI guidelines on Basel II)
During fiscal 2012, capital funds increased by ` 70.88 billion primarily due to accretion to retained earnings,
incremental notional tax payable on special reserves of ` 2.11 billion, the issuance of lower Tier-II debt capital
of ` 16.00 billion and reduction of ` 20.60 billion in deduction from capital funds on account of securitisation
exposures.
Credit risk RWA increased by ` 558.95 billion from ` 2,909.79 billion at March 31, 2011 to ` 3,468.74 billion
at March 31, 2012 primarily due to increase of ` 409.48 billion in RWA for on-balance sheet credit exposures
and increase of ` 149.47 billion in RWA for off-balance sheet credit exposures.
Market risk RWA increased by ` 13.14 billion from ` 255.52 billion at March 31, 2011 to ` 268.66 billion at
March 31, 2012. The general market risk RWA increased by ` 15.35 billion (capital charge of ` 1.38 billion).
The operational risk RWA at March 31, 2012 was ` 248.46 billion (capital charge of ` 22.36 billion). The
operational risk capital charge is computed based on 15% of average of previous three financial years’ gross
income and is revised on an annual basis at June 30.
Internal assessment of capital
Our capital management framework includes a comprehensive internal capital adequacy assessment process
conducted annually, which determines the adequate level of capitalisation necessary to meet regulatory
norms and current and future business needs, including under stress scenarios. The internal capital adequacy
assessment process is formulated at both the standalone bank level and the consolidated group level. The
process encompasses capital planning for a certain time horizon, identification and measurement of material
risks and the relationship between risk and capital.
Management’s Discussion & Analysis