ICICI Bank 2012 Annual Report Download - page 57
Download and view the complete annual report
Please find page 57 of the 2012 ICICI Bank annual report below. You can navigate through the pages in the report by either clicking on the pages listed below, or by using the keyword search tool below to find specific information within the annual report.-
 1
1 -
2
-
3
-
4
-
5
-
6
-
7
-
8
-
9
-
10
-
11
-
12
-
13
-
14
-
15
-
16
-
17
-
18
-
19
-
20
-
21
-
22
-
23
-
24
-
25
-
26
-
27
-
28
-
29
-
30
-
31
-
32
-
33
-
34
-
35
-
36
-
37
-
38
-
39
-
40
-
41
-
42
-
43
-
44
-
45
-
46
-
 47
47 -
 48
48 -
 49
49 -
 50
50 -
 51
51 -
 52
52 -
 53
53 -
 54
54 -
 55
55 -
 56
56 -
 57
57 -
 58
58 -
 59
59 -
 60
60 -
 61
61 -
 62
62 -
 63
63 -
 64
64 -
 65
65 -
 66
66 -
 67
67 -
68
-
69
-
70
-
71
-
72
-
73
-
74
-
75
-
76
-
77
-
78
-
79
-
80
-
81
-
82
-
83
-
84
-
85
-
86
-
87
-
88
-
89
-
90
-
91
-
92
-
93
-
94
-
95
-
96
-
97
-
98
-
99
-
100
-
101
-
102
-
103
-
104
-
105
-
106
-
107
-
108
-
109
-
110
-
111
-
112
-
113
-
114
-
115
-
116
-
117
-
118
-
119
-
120
-
121
-
122
-
123
-
124
-
125
-
126
-
127
-
128
-
129
-
130
-
131
-
132
-
133
-
134
-
135
-
136
-
137
-
138
-
139
-
140
-
141
-
142
-
143
-
144
-
145
-
146
-
147
-
148
-
149
-
150
-
151
-
152
-
153
-
154
-
155
-
156
-
157
-
158
-
159
-
160
-
161
-
162
-
163
-
164
-
165
-
166
-
167
-
168
-
169
-
170
-
171
-
172
-
173
-
174
-
175
-
176
-
177
-
178
-
179
-
180
-
181
-
182
-
183
-
184
-
185
-
186
-
187
-
188
-
189
-
190
-
191
-
192
-
193
-
194
-
195
-
196
-
197
-
198
-
199
-
200
-
201
-
202
-
203
-
204
-
205
-
206
-
207
-
208
-
209
-
210
-
211
-
212
 |
 |

Annual Report 2011-2012 55
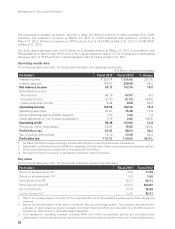
The average volume of interest-earning assets increased by 15.0% from ` 3,418.59 billion in fiscal 2011 to
` 3,932.59 billion in fiscal 2012. The increase in average interest-earning assets was primarily on account of an
increase in average advances by ` 390.17 billion and average interest-earning investments by ` 100.04 billion.
Average advances increased by 20.3% from ` 1,926.52 billion in fiscal 2011 to ` 2,316.69 billion in fiscal
2012 primarily on account of increase in domestic and overseas corporate advances. Retail advances
increased by 7.7% from ` 836.75 billion at March 31, 2011 to ` 901.30 billion at March 31, 2012.
In US dollar terms, the net advances of overseas branches increased by 9.7% from US$ 12.4 billion
at March 31, 2011 to US$ 13.6 billion at March 31, 2012. However, due to rupee depreciation, the net
advances of overseas branches, in rupee terms, increased by 26.0% from ` 550.97 billion at March 31, 2011 to
` 694.03 billion at March 31, 2012.
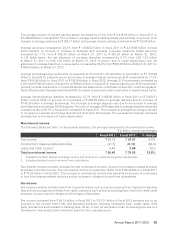
Average interest-earning investments increased by 8.1% from ` 1,237.42 billion in fiscal 2011 to ` 1,337.46
billion in fiscal 2012, primarily due to an increase in average interest-earning non-SLR investments by 17.0%
from ` 455.34 billion in fiscal 2011 to ` 532.94 billion in fiscal 2012. Average SLR investments increased by
2.9% from ` 782.07 billion in fiscal 2011 to ` 804.52 billion in fiscal 2012. Interest-earning non-SLR investments
primarily include investments in corporate bonds and debentures, certificates of deposits, commercial paper,
Rural Infrastructure Development Fund (RIDF) & related investments and investments in liquid mutual funds.
Average interest-bearing liabilities increased by 13.7% from ` 3,168.26 billion in fiscal 2011 to ` 3,603.51
billion in fiscal 2012 on account of an increase of ` 289.89 billion in average deposits and an increase of
` 145.35 billion in average borrowings. The increase in average deposits was due to an increase in average
term deposits and average CASA deposits. The ratio of average CASA deposits to average deposits remained
constant at about 39.1% in fiscal 2012 compared to fiscal 2011. The increase in average borrowings was due
to increase in overseas borrowings and call and short-term borrowings. The overseas borrowings increased
primarily due to the impact of rupee depreciation.
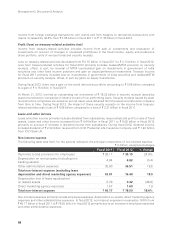
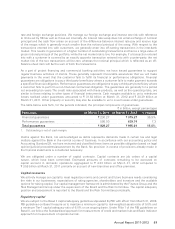
Non-interest income
The following tables set forth, for the periods indicated, the principal components of non-interest income.
` in billion, except percentages
Fiscal 2011 Fiscal 2012 % change
Fee income1` 64.19 ` 67.07 4.5%
Income from treasury-related activities (2.15) (0.13) (94.0)
Lease and other income24.44 8.08 82.0
Total non-interest income ` 66.48 ` 75.02 12.8%
1. Includes merchant foreign exchange income and income on customer derivative transactions.
2. Includes dividend income received from subsidiaries.
Non-interest income primarily includes fee and commission income, income from treasury-related activities
and lease and other income. The non-interest income increased by 12.8% from ` 66.48 billion in fiscal 2011
to ` 75.02 billion in fiscal 2012. The increase in non-interest income was primarily on account of a decrease
in loss from treasury-related activities and an increase in dividend income from subsidiaries.
Fee income
Fee income primarily includes fees from corporate clients such as loan processing fees, transaction banking
fees and structuring fees and fees from retail customers such as loan processing fees, fees from credit cards
business, account service charges and third party referral fees.
Fee income increased from ` 64.19 billion in fiscal 2011 to ` 67.07 billion in fiscal 2012 primarily due to an
increase in fee income from forex and derivative products including remittance fees, credit cards, third
party referral fees and transaction banking fees, offset, in part, by decrease in loan processing fees due to a
slowdown in new project and investment plans for the corporate sector.