ICICI Bank 2012 Annual Report Download - page 106
Download and view the complete annual report
Please find page 106 of the 2012 ICICI Bank annual report below. You can navigate through the pages in the report by either clicking on the pages listed below, or by using the keyword search tool below to find specific information within the annual report.-
 1
1 -
2
-
3
-
4
-
5
-
6
-
7
-
8
-
9
-
10
-
11
-
12
-
13
-
14
-
15
-
16
-
17
-
18
-
19
-
20
-
21
-
22
-
23
-
24
-
25
-
26
-
27
-
28
-
29
-
30
-
31
-
32
-
33
-
34
-
35
-
36
-
37
-
38
-
39
-
40
-
41
-
42
-
43
-
44
-
45
-
46
-
47
-
48
-
49
-
50
-
51
-
52
-
53
-
54
-
55
-
56
-
57
-
58
-
59
-
60
-
61
-
62
-
63
-
64
-
65
-
66
-
67
-
68
-
69
-
70
-
71
-
72
-
73
-
74
-
75
-
76
-
77
-
78
-
79
-
80
-
81
-
82
-
83
-
84
-
85
-
86
-
87
-
88
-
89
-
90
-
91
-
92
-
93
-
94
-
95
-
 96
96 -
 97
97 -
 98
98 -
 99
99 -
 100
100 -
 101
101 -
 102
102 -
 103
103 -
 104
104 -
 105
105 -
 106
106 -
 107
107 -
 108
108 -
 109
109 -
 110
110 -
 111
111 -
 112
112 -
 113
113 -
 114
114 -
 115
115 -
 116
116 -
117
-
118
-
119
-
120
-
121
-
122
-
123
-
124
-
125
-
126
-
127
-
128
-
129
-
130
-
131
-
132
-
133
-
134
-
135
-
136
-
137
-
138
-
139
-
140
-
141
-
142
-
143
-
144
-
145
-
146
-
147
-
148
-
149
-
150
-
151
-
152
-
153
-
154
-
155
-
156
-
157
-
158
-
159
-
160
-
161
-
162
-
163
-
164
-
165
-
166
-
167
-
168
-
169
-
170
-
171
-
172
-
173
-
174
-
175
-
176
-
177
-
178
-
179
-
180
-
181
-
182
-
183
-
184
-
185
-
186
-
187
-
188
-
189
-
190
-
191
-
192
-
193
-
194
-
195
-
196
-
197
-
198
-
199
-
200
-
201
-
202
-
203
-
204
-
205
-
206
-
207
-
208
-
209
-
210
-
211
-
212
 |
 |

F28
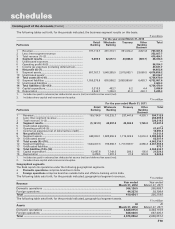
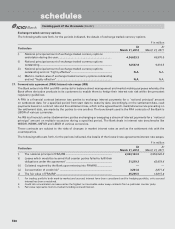
Exchange traded currency options
The following table sets forth, for the periods indicated, the details of exchange traded currency options.
` in million
Particulars At
March 31, 2012
At
March 31, 2011
i) Notional principal amount of exchange traded currency options
undertaken during the year ......................................................................... 4,34,623.3 43,970.0
ii) Notional principal amount of exchange traded currency options
outstanding .................................................................................................. 12,587.8 9,418.5
iii) Notional principal amount of exchange traded currency options
outstanding and not “highly effective” ....................................................... N.A. N.A.
iv) Mark-to-market value of exchange traded currency options outstanding
and not “highly effective” ........................................................................... N.A. N.A.
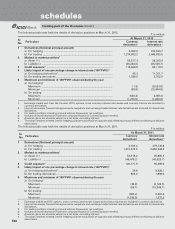
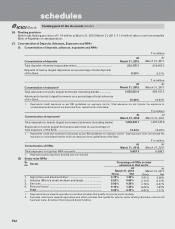
17. Forward rate agreement (FRA)/Interest rate swaps (IRS)
The Bank enters into FRA and IRS contracts for balance sheet management and market making purposes whereby the
Bank offers derivative products to its customers to enable them to hedge their interest rate risk within the prevalent
regulatory guidelines.
A FRA is a financial contract between two parties to exchange interest payments for a `notional principal’ amount
on settlement date, for a specified period from start date to maturity date. Accordingly, on the settlement date, cash
payments based on contract rate and the settlement rate, which is the agreed bench-mark/reference rate prevailing on
the settlement date, are made by the parties to one another. The benchmark used in the FRA contracts of the Bank is
LIBOR of various currencies.
An IRS is a financial contract between two parties exchanging or swapping a stream of interest payments for a `notional
principal’ amount on multiple occasions during a specified period. The Bank deals in interest rate benchmarks like
MIBOR, INBMK, MIFOR and LIBOR of various currencies.
These contracts are subject to the risks of changes in market interest rates as well as the settlement risk with the
counterparties.
The following table sets forth, for the periods indicated, the details of the forward rate agreements/interest rate swaps.
` in million
Particulars At
March 31, 2012
At
March 31, 2011
i) The notional principal of FRA/IRS .............................................................. 2,603,143.0 3,952,522.3
ii) Losses which would be incurred if all counter parties failed to fulfil their
obligations under the agreement1 ............................................................. 31,219.3 42,479.4
iii) Collateral required by the Bank upon entering into FRA/IRS .................... ——
iv) Concentration of credit risk2 ...................................................................... 3,261.6 2,871.4
v) The fair value of FRA/IRS3 ........................................................................... 25,235.5 13,615.4
1. For trading portfolio both mark-to-market and accrued interest have been considered and for hedging portfolio, only accrued
interest has been considered.
2. Credit risk concentration is measured as the highest net receivable under swap contracts from a particular counter party.
3. Fair value represents mark-to-market including accrued interest.
forming part of the Accounts (Contd.)
schedules