ICICI Bank 2012 Annual Report Download - page 69
Download and view the complete annual report
Please find page 69 of the 2012 ICICI Bank annual report below. You can navigate through the pages in the report by either clicking on the pages listed below, or by using the keyword search tool below to find specific information within the annual report.-
 1
1 -
2
-
3
-
4
-
5
-
6
-
7
-
8
-
9
-
10
-
11
-
12
-
13
-
14
-
15
-
16
-
17
-
18
-
19
-
20
-
21
-
22
-
23
-
24
-
25
-
26
-
27
-
28
-
29
-
30
-
31
-
32
-
33
-
34
-
35
-
36
-
37
-
38
-
39
-
40
-
41
-
42
-
43
-
44
-
45
-
46
-
47
-
48
-
49
-
50
-
51
-
52
-
53
-
54
-
55
-
56
-
57
-
58
-
 59
59 -
 60
60 -
 61
61 -
 62
62 -
 63
63 -
 64
64 -
 65
65 -
 66
66 -
 67
67 -
 68
68 -
 69
69 -
 70
70 -
 71
71 -
 72
72 -
 73
73 -
 74
74 -
 75
75 -
 76
76 -
 77
77 -
 78
78 -
 79
79 -
80
-
81
-
82
-
83
-
84
-
85
-
86
-
87
-
88
-
89
-
90
-
91
-
92
-
93
-
94
-
95
-
96
-
97
-
98
-
99
-
100
-
101
-
102
-
103
-
104
-
105
-
106
-
107
-
108
-
109
-
110
-
111
-
112
-
113
-
114
-
115
-
116
-
117
-
118
-
119
-
120
-
121
-
122
-
123
-
124
-
125
-
126
-
127
-
128
-
129
-
130
-
131
-
132
-
133
-
134
-
135
-
136
-
137
-
138
-
139
-
140
-
141
-
142
-
143
-
144
-
145
-
146
-
147
-
148
-
149
-
150
-
151
-
152
-
153
-
154
-
155
-
156
-
157
-
158
-
159
-
160
-
161
-
162
-
163
-
164
-
165
-
166
-
167
-
168
-
169
-
170
-
171
-
172
-
173
-
174
-
175
-
176
-
177
-
178
-
179
-
180
-
181
-
182
-
183
-
184
-
185
-
186
-
187
-
188
-
189
-
190
-
191
-
192
-
193
-
194
-
195
-
196
-
197
-
198
-
199
-
200
-
201
-
202
-
203
-
204
-
205
-
206
-
207
-
208
-
209
-
210
-
211
-
212
 |
 |

Annual Report 2011-2012 67
Our provision coverage ratio (i.e. total provisions made against NPAs as a percentage of gross NPAs)
at March 31, 2012 was 80.4%. At March 31, 2012, total general provision held against standard assets
was ` 14.80 billion compared to the general provision requirement as per the RBI guidelines of about
` 13.82 billion. The excess provision was not reversed in line with the RBI guidelines.
At March 31, 2012, the net non-performing loans in the retail portfolio were 0.8% of net retail loans as
compared with 1.5% at March 31, 2011. The decrease in the ratio was primarily on account of sharp decline
in accretion to retail NPAs and higher provisioning against retail loans. At March 31, 2012, the net non-
performing loans in the collateralised retail portfolio were 0.7% of the net collateralised retail loans and
net non-performing loans in the non-collateralised retail portfolio (including overdraft financing against
automobiles) were about 2.4% of net non-collateralised retail loans.
During fiscal 2012, we restructured loans aggregating ` 36.42 billion as compared to ` 13.66 billion during
fiscal 2011.
Our aggregate investments in security receipts issued by asset reconstruction companies were ` 18.32
billion at March 31, 2012 as compared to ` 28.31 billion at March 31, 2011.
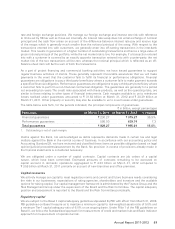
Classification of non-performing assets by industry
The following table sets forth, at March 31, 2011 and March 31, 2012, the composition of gross non-
performing assets by industry sector.
` in billion, except percentages
March 31, 2011 March 31, 2012
Amount % Amount %
Retail finance1` 66.35 65.6% ` 59.79 62.5%
Food and beverages 2.88 2.9 2.64 2.8
Electronics and engineering 0.68 0.7 2.38 2.5
Wholesale/retail trade 3.85 3.8 2.12 2.2
Textiles 2.25 2.2 1.84 1.9
Gems and jewellery 1.76 1.7 1.75 1.8
Chemicals and fertilisers 2.05 2.0 1.56 1.6
Metal and metal products 1.30 1.3 1.11 1.2
Services – finance 2.30 2.3 1.07 1.1
Iron/steel and iron/steel products 0.17 0.2 0.95 1.0
Paper and paper products 0.46 0.5 0.79 0.8
Shipping 0.06 0.1 0.45 0.5
Services – non finance 0.38 0.4 0.39 0.4
Automobiles 0.55 0.5 0.18 0.2
Power 0.18 0.2 0.09 0.1
Other industries215.92 15.6 18.52 19.4
Total ` 101.14 100.0% ` 95.63 100.0%
1. Includes home loans, automobile loans, commercial business loans, two wheeler loans, personal loans and
credit cards. Also includes NPAs in dealer funding and developer finance portfolios.
2. Other industries primarily include construction, drugs and pharmaceuticals, construction, agriculture and allied
activities, FMCG, gems and jewellery, manufacturing products excluding metal, crude petroleum/refining and
petrochemicals, mining, cement, etc.
3. All amounts have been rounded off to the nearest ` 10.0 million.