ICICI Bank 2012 Annual Report Download - page 61
Download and view the complete annual report
Please find page 61 of the 2012 ICICI Bank annual report below. You can navigate through the pages in the report by either clicking on the pages listed below, or by using the keyword search tool below to find specific information within the annual report.-
 1
1 -
2
-
3
-
4
-
5
-
6
-
7
-
8
-
9
-
10
-
11
-
12
-
13
-
14
-
15
-
16
-
17
-
18
-
19
-
20
-
21
-
22
-
23
-
24
-
25
-
26
-
27
-
28
-
29
-
30
-
31
-
32
-
33
-
34
-
35
-
36
-
37
-
38
-
39
-
40
-
41
-
42
-
43
-
44
-
45
-
46
-
47
-
48
-
49
-
50
-
 51
51 -
 52
52 -
 53
53 -
 54
54 -
 55
55 -
 56
56 -
 57
57 -
 58
58 -
 59
59 -
 60
60 -
 61
61 -
 62
62 -
 63
63 -
 64
64 -
 65
65 -
 66
66 -
 67
67 -
 68
68 -
 69
69 -
 70
70 -
 71
71 -
72
-
73
-
74
-
75
-
76
-
77
-
78
-
79
-
80
-
81
-
82
-
83
-
84
-
85
-
86
-
87
-
88
-
89
-
90
-
91
-
92
-
93
-
94
-
95
-
96
-
97
-
98
-
99
-
100
-
101
-
102
-
103
-
104
-
105
-
106
-
107
-
108
-
109
-
110
-
111
-
112
-
113
-
114
-
115
-
116
-
117
-
118
-
119
-
120
-
121
-
122
-
123
-
124
-
125
-
126
-
127
-
128
-
129
-
130
-
131
-
132
-
133
-
134
-
135
-
136
-
137
-
138
-
139
-
140
-
141
-
142
-
143
-
144
-
145
-
146
-
147
-
148
-
149
-
150
-
151
-
152
-
153
-
154
-
155
-
156
-
157
-
158
-
159
-
160
-
161
-
162
-
163
-
164
-
165
-
166
-
167
-
168
-
169
-
170
-
171
-
172
-
173
-
174
-
175
-
176
-
177
-
178
-
179
-
180
-
181
-
182
-
183
-
184
-
185
-
186
-
187
-
188
-
189
-
190
-
191
-
192
-
193
-
194
-
195
-
196
-
197
-
198
-
199
-
200
-
201
-
202
-
203
-
204
-
205
-
206
-
207
-
208
-
209
-
210
-
211
-
212
 |
 |

Annual Report 2011-2012 59
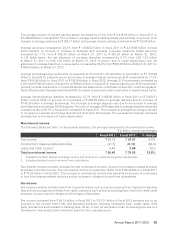
Investments
Total investments increased by 18.5% from ` 1,346.86 billion at March 31, 2011 to ` 1,595.60 billion at
March 31, 2012, primarily due to an increase in investment in government securities by ` 228.19 billion,
corporate bonds and debentures by ` 33.67 billion, RIDF and related investments in lieu of shortfall in directed
lending requirements by ` 30.23 billion and certificates of deposit by ` 16.83 billion at March 31, 2012
compared to March 31, 2011. The investment in mutual funds decreased by ` 17.25 billion, gross funded
credit derivatives by ` 10.60 billion, pass-through-certificates by ` 9.71 billion and commercial paper by ` 5.70
billion at March 31, 2012 compared to March 31, 2011. The transactions with RBI under LAF are accounted
for as borrowing and lending transactions at March 31, 2012, while they were previously accounted for as
purchase and sale transactions. At March 31, 2012, we had an outstanding net investment of ` 18.32 billion
in security receipts issued by asset reconstruction companies in relation to sale of non-performing loans
compared to ` 28.31 billion at March 31, 2011. At March 31, 2012, we have notional non-funded credit
derivatives of ` 10.25 billion. We have no funded credit derivatives outstanding at March 31, 2012.
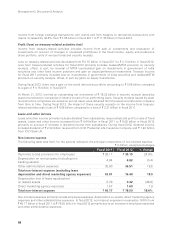
Advances
Net advances increased by 17.3% from ` 2,163.66 billion at March 31, 2011 to ` 2,537.28 billion at March 31,
2012 primarily due to increase in domestic and overseas corporate loans. Net retail advances increased
by 7.7% from ` 836.75 billion at March 31, 2011 to ` 901.30 billion at March 31, 2012. Net advances of
overseas branches (including offshore banking unit) increased in USD terms by 9.7% from US$ 12.4 billion at
March 31, 2011 to US$ 13.6 billion at March 31, 2012. In rupee terms, net advances of overseas branches
(including offshore banking unit) increased by 26.0% from ` 550.97 billion at March 31, 2011 to ` 694.03
billion at March 31, 2012.
Fixed and other assets
Net fixed assets decreased by 2.7% from ` 47.44 billion at March 31, 2011 to ` 46.15 billion at
March 31, 2012 primarily due to a decrease in assets given on lease. Other assets increased by 19.4% from
` 163.48 billion at March 31, 2011 to ` 195.15 billion at March 31, 2012.
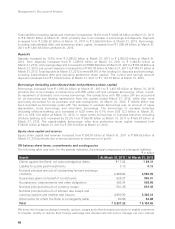
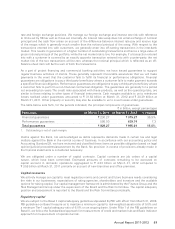
Liabilities
The following table sets forth, at the dates indicated, the principal components of liabilities (including capital
and reserves).
` in billion, except percentages
Liabilities At March 31, 2011 At March 31, 2012 % change
Equity share capital ` 11.52 ` 11.53 0.1%
Reserves 539.39 592.52 9.9
Deposits 2,256.02 2,555.00 13.3
- Savings account deposits 668.69 760.46 13.7
- Current account deposits 347.78 349.73 0.6
- Term deposits 1,239.55 1,444.81 16.6
Borrowings (excluding subordinated debt
and preference share capital) 728.13 1,022.00 40.4
- Domestic 192.75 377.38 95.8
- Overseas branches 535.38 644.62 20.4
Subordinated debt (included in Tier-1 and
Tier-2 capital)1363.91 376.15 3.4
- Domestic 348.80 358.90 2.9
- Overseas branches 15.11 17.25 14.2
Preference share capital 3.50 3.50 —
Other liabilities 159.87 175.77 9.9
Total liabilities ` 4,062.34 ` 4,736.47 16.6%
1. Included in Schedule 4 - “Borrowings” of the balance sheet.
2. All amounts have been rounded off to the nearest ` 10.0 million.