Volvo 2011 Annual Report Download - page 99
Download and view the complete annual report
Please find page 99 of the 2011 Volvo annual report below. You can navigate through the pages in the report by either clicking on the pages listed below, or by using the keyword search tool below to find specific information within the annual report.-
 1
1 -
2
-
3
-
4
-
5
-
6
-
7
-
8
-
9
-
10
-
11
-
12
-
13
-
14
-
15
-
16
-
17
-
18
-
19
-
20
-
21
-
22
-
23
-
24
-
25
-
26
-
27
-
28
-
29
-
30
-
31
-
32
-
33
-
34
-
35
-
36
-
37
-
38
-
39
-
40
-
41
-
42
-
43
-
44
-
45
-
46
-
47
-
48
-
49
-
50
-
51
-
52
-
53
-
54
-
55
-
56
-
57
-
58
-
59
-
60
-
61
-
62
-
63
-
64
-
65
-
66
-
67
-
68
-
69
-
70
-
71
-
72
-
73
-
74
-
75
-
76
-
77
-
78
-
79
-
80
-
81
-
82
-
83
-
84
-
85
-
86
-
87
-
88
-
 89
89 -
 90
90 -
 91
91 -
 92
92 -
 93
93 -
 94
94 -
 95
95 -
 96
96 -
 97
97 -
 98
98 -
 99
99 -
 100
100 -
 101
101 -
 102
102 -
 103
103 -
 104
104 -
 105
105 -
 106
106 -
 107
107 -
 108
108 -
 109
109 -
110
-
111
-
112
-
113
-
114
-
115
-
116
-
117
-
118
-
119
-
120
-
121
-
122
-
123
-
124
-
125
-
126
-
127
-
128
-
129
-
130
-
131
-
132
-
133
-
134
-
135
-
136
-
137
-
138
-
139
-
140
-
141
-
142
-
143
-
144
-
145
-
146
-
147
-
148
-
149
-
150
-
151
-
152
-
153
-
154
-
155
-
156
-
157
-
158
-
159
-
160
-
161
-
162
-
163
-
164
-
165
-
166
 |
 |

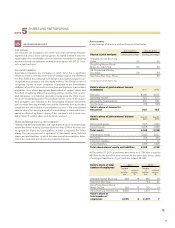
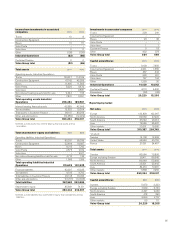
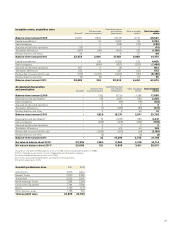
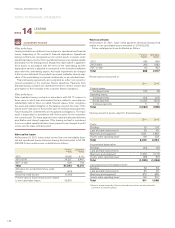
Investments in associated companies 2011 2010
Trucks 228 241
Construction Equipment – –
Buses 23 46
Volvo Penta – –
Volvo Aero 1 1
Customer Finance 0 18
Other 432 378
Volvo Group total 684 684
Capital expenditures 2011 2010
Trucks 9,138 7,650
Construction Equipment 2,231 1,555
Buses 367 343
Volvo Penta 332 331
Volvo Aero 797 734
Other 1,293 30
Industrial Operations 14,159 10,643
Customer Finance 6,112 4,600
Eliminations (52) (38)
Volvo Group total 20,220 15,205
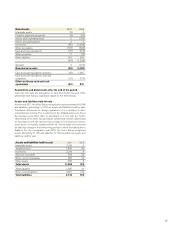
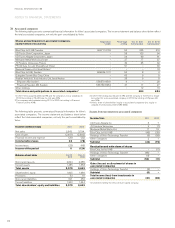
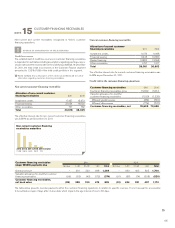
Reporting by market
Net sales 2011 2010
Europe 120,828 102,947
North America 60,560 47,922
South America 35,142 29,013
Asia 73,586 65,487
Other markets 20,251 19,380
Volvo Group total* 310,367 264,749
*of which:
Sweden 14,108 12,463
United States 46,984 35,752
France 27,061 24,457
Total assets 2011 2010
Sweden 80,584 73,806
Europe excluding Sweden 93,411 86,645
North America 60,948 53,683
South America 25,521 23,442
Asia 84,913 72,481
Other markets 7,868 7,950
Volvo Group total 353,244 318,007
Capital expenditures 2011 2010
Sweden 5,670 3,323
Europe excluding Sweden 7,639 6,733
North America 3,427 2,039
South America 478 292
Asia 2,953 2,707
Other markets 53 111
Volvo Group total 20,220 15,205
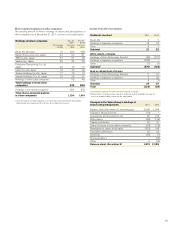
Income from investments in associated
companies 2011 2010
Trucks 10 8
Construction Equipment – –
Buses 13 15
Volvo Penta – –
Volvo Aero 0 0
Other (105) (109)
Industrial Operations (82) (86)
Customer Finance 0 0
Volvo Group total (82) (86)
Total assets 2011 2010
Operating assets, Industrial Operations1:
Trucks 126,617 114,169
Construction Equipment 47,742 43,309
Buses 11,905 11,565
Volvo Penta 5,026 4,870
Volvo Aero – 9,881
Non-interest bearing assets held for sale 9,344 136
Other 7,831 2,051
Total operating assets Industrial
Operations 208,464 185,981
Interest-bearing financial assets 42,689 42,645
Tax receivables 13,632 13,064
Total assets in Customer Finance 99,147 89,246
Other and eliminations (10,689) (12,929)
Volvo Group total 353,244 318,007
1 Defined as total assets less interest-bearing financial assets and tax
receivables.
Total shareholders' equity and liabilities 2011 2010
Operating liabilities, Industrial Operations1:
Trucks 80,031 69,039
Construction Equipment 22,494 18,697
Buses 8,213 7,762
Volvo Penta 2,575 2,519
Volvo Aero – 3,517
Non interest-bearingliabilities held for sale 4,710 135
Other 1,586 1,259
Total operating liabilities Industrial
Operations 119,609 102,928
Financial liabilities 62,037 67,335
Tax liabilities 6,515 4,702
Total liabilities in Customer Finance 90,148 81,226
Other and eliminations (10,747) (12,305)
Total liabilities 267,563 243,886
Shareholders' equity 85,681 74,121
Volvo Group total 353,244 318,007
1 Defined as total liabilities less shareholders’ equity, financial liabilities and tax
liabilities.
95